

Abstract
Marine ice-sheet instability is a geometric feedback, not a date on a forecast calendar. Grounding-line theory, numerical experiments and observed retreat constrain different links in the argument. This review separates flotation geometry, discharge sensitivity, buttressing and forcing, then shows why identifying a positive feedback does not by itself determine the timing or magnitude of future ice loss.
The grounding line is a moving boundary
The grounding line separates ice supported by the bed from floating ice. Its position depends on ice thickness, bed depth and force balance. Retreat into deeper water can require thicker ice at flotation and can increase discharge under appropriate dynamical assumptions. The resulting feedback is physically specific; it cannot be inferred from a map of bed slope without considering stresses, geometry and the surrounding ice shelf.
Theory, simulation and observation
Schoof developed grounding-line stability theory for an idealized marine ice sheet. Favier and colleagues examined retreat and instability of Pine Island Glacier through numerical modeling. Rignot and colleagues measured widespread grounding-line retreat in sectors of West Antarctica over a historical interval. These studies provide a theoretical mechanism, model-dependent trajectories and observations of change. They do not constitute three independent measurements of a universal collapse date. [1], [2], [3]
Flotation turns depth into thickness
At the flotation boundary, the weight of an ice column balances displaced seawater in a hydrostatic idealization. Greater water depth therefore implies greater flotation thickness. This geometric relation is comparatively simple, but the discharge resulting from that thickness depends on flow mechanics. Keeping geometry and dynamics separate makes clear where a prediction gains uncertainty.
Discharge can amplify a small geometric change
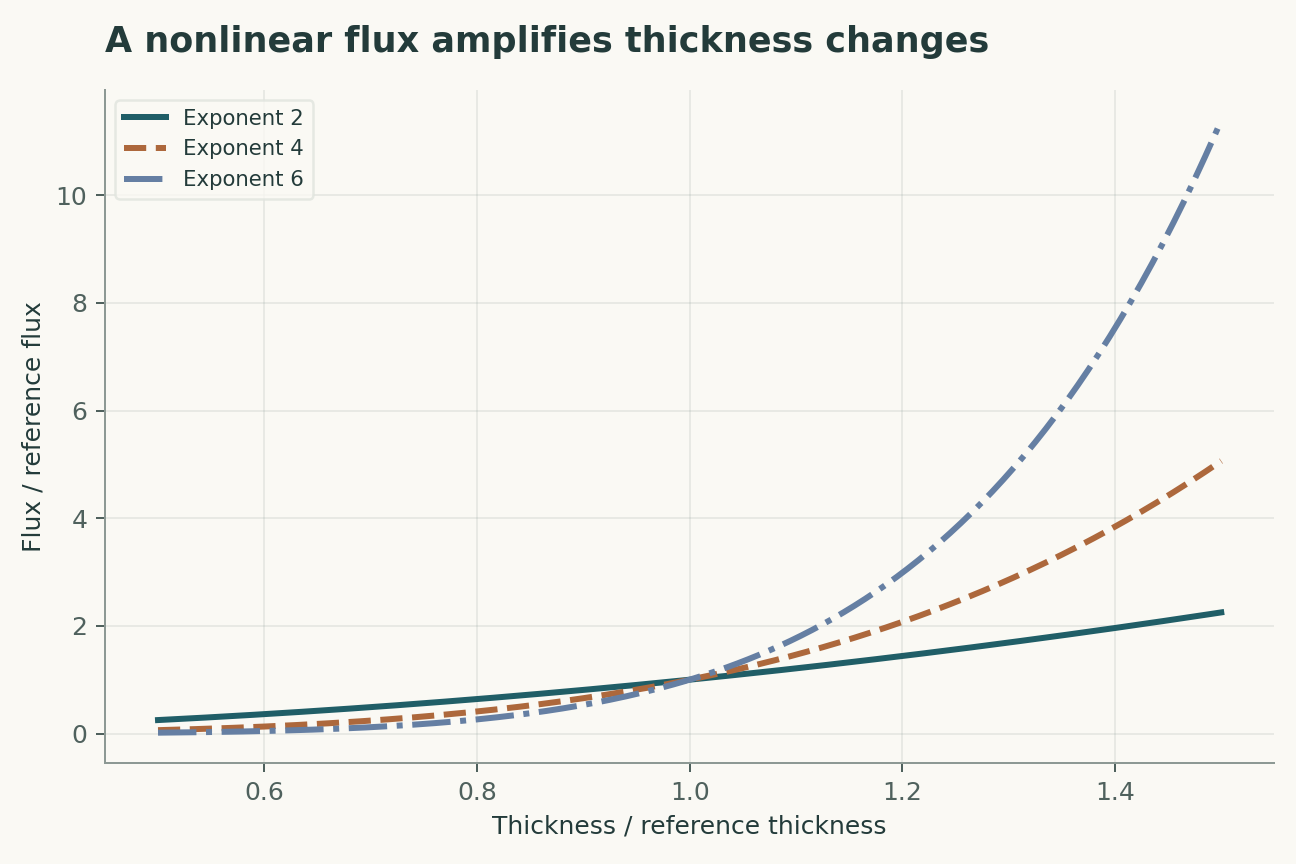
A power-law dependence of grounding-line flux on thickness can amplify a modest increase in thickness. The exponent and prefactor depend on constitutive assumptions and stress conditions. A steep relation is an argument for sensitivity, not a license to extrapolate one local fit across all glaciers. Basal friction, lateral drag and shelf conditions can change the relevant response.
Buttressing is a stress interaction
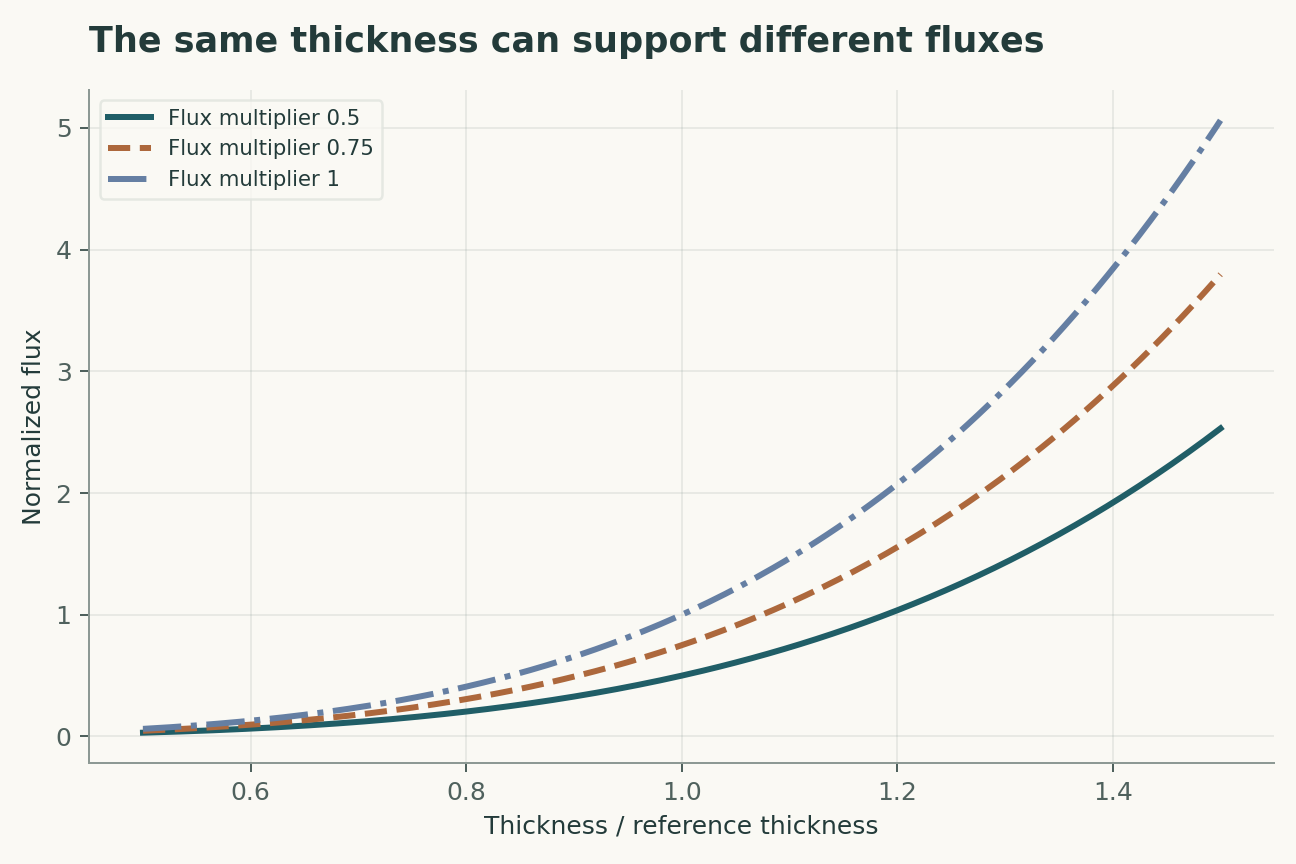
An ice shelf can transmit stresses that restrain upstream flow. Its effect depends on geometry, contact and lateral confinement, rather than only on its total area. Losing one part of a shelf may matter more than losing another. A scalar buttressing factor is useful for a sensitivity illustration, but a quantitative forecast generally requires a spatial stress solution.
Instability differs from externally forced retreat
A glacier may retreat because external forcing changes, because internal feedback amplifies a perturbation, or through both processes. Observed retreat alone does not uniquely partition these contributions. Perturbation experiments in a model can test whether retreat persists after forcing is relaxed, but that conclusion remains conditional on model structure and initial state.
A threshold does not determine a clock
Even if a stable state disappears, the rate of subsequent change can depend strongly on ice viscosity, basal conditions and evolving geometry. Slow passages near a threshold and transient forcing further complicate timing. Reporting a threshold crossing as an immediate realization of its long-term consequence confuses stability with kinetics.
Forecast evaluation should expose alternatives
Useful ensembles vary both uncertain parameters and plausible process representations. Multiple runs of one model with narrowly varied inputs do not capture all structural uncertainty. Observed grounding-line positions, velocity fields and thickness changes can jointly test trajectories. A forecast becomes more informative when it states which new observations would distinguish its high-loss and low-loss explanations.
A threshold claim needs both geometry and forcing
Retreat on a retrograde bed can amplify discharge in an idealized marine ice-sheet system, but the realized response also depends on lateral confinement, buttressing and forcing history. A proposed model comparison would vary those components separately and ask which changes reproduce both grounding-line movement and upstream thinning. Matching one of the two can conceal compensating errors. The power-law figure isolates sensitivity to thickness; it is not a substitute for solving the coupled geometry and stress problem. A threshold should be expressed as conditional on the boundary conditions rather than as an intrinsic date attached to the glacier.
A forecast interval must include structural alternatives
Increasing spatial resolution can improve a model while leaving uncertainty in basal conditions or ocean forcing dominant. A useful ensemble would therefore distinguish numerical convergence from parameter variation and from alternative physical assumptions. Forecast performance should be assessed on withheld periods with observations of the relevant mechanisms, not only an integrated sea-level contribution. If several models match past mass loss but disagree on future grounding-line behavior, the historical fit has not resolved the instability. The next valuable observation is one that distinguishes those alternatives, even if it contributes little to reducing the current error in total mass.
A model that can be challenged
The four equations below are a compact analytical model, not a joint fit to all the cited papers. Their interpretation is as follows. Hydrostatic flotation relates ice thickness H to positive water depth D using ice and seawater densities. An illustrative flux law with exponent beta exposes thickness sensitivity; it is not a universal grounding-line formula. Ice volume V changes with integrated accumulation A minus discharge Q in a deliberately reduced balance. A small-perturbation approximation; finite changes should use the full power law and changing stress conditions may invalidate fixed beta.
The observational target is grounding-line position, discharge and thickness change. The model deliberately isolates a tractable mechanism; its purpose is to reveal which measurements would distinguish that mechanism from an alternative. Parameter values in the figures are declared illustrative inputs. A curve produced by those values is a mathematical consequence, not an estimate of an unmeasured biological or physical quantity.
A discriminating validation design
The primary comparison should test joint prediction of retreat, velocity and thickness. The unit of independent replication is independent glacier sector and observation epoch; repeated readings from the same unit improve precision but do not create independent replication. A strong validation would hold out different shelf geometries and forcing histories before choosing thresholds or fitting nuisance corrections. In particular, uncertain basal stress and evolving buttressing must be measured, constrained or varied in a sensitivity analysis. Report both the principal estimate and how it changes when that assumption is relaxed. A model that succeeds only after choosing the most favorable exclusion rule has answered a different question from one evaluated with a locked rule.
Worked numerical analysis
In the constructed flux law, beta = 4 and a 10% thickness increase give a discharge factor 1.1 to the fourth power, or 1.4641. The linear approximation gives 1.4 and underestimates the finite change. A second panel varies an illustrative multiplicative restraint factor separately from thickness. These sensitivity curves are not calibrated ice-sheet projections and provide no estimate of a collapse year or sea-level contribution.
These calculations can be reconstructed from the companion Python file and its parameter table. Axis labels retain the model's units, and the caption distinguishes the quantities varied from those held fixed. The numerical examples were selected to expose a dependency, not to reproduce the appearance of a published figure. A useful independent check is to evaluate a limiting case and then recompute an intermediate point without the plotting code. Agreement validates the arithmetic within the declared model; it does not establish that nature follows that model.
Evidence, transfer and next steps
The scope of the conclusion is limited by uncertain basal stress and evolving buttressing. Transfer to different shelf geometries and forcing histories requires evidence beyond fitting the original observations. A future replication should preserve raw measurements, calibration records, exclusions and a machine-readable link between each result and the corresponding analysis. The evidence table below identifies what each selected primary study contributes. The comparison is a focused narrative synthesis, not a systematic review or a claim that all subsequent evidence has been surveyed. The proposed study has not been performed here. Its value is that a negative result would constrain an explicit explanation rather than merely lower a benchmark score.
A declared analytical model
Four equations, explicit assumptions
(1) Hydrostatic flotation relates ice thickness H to positive water depth D using ice and seawater densities.
(2) An illustrative flux law with exponent beta exposes thickness sensitivity; it is not a universal grounding-line formula.
(3) Ice volume V changes with integrated accumulation A minus discharge Q in a deliberately reduced balance.
(4) A small-perturbation approximation; finite changes should use the full power law and changing stress conditions may invalidate fixed beta.
Constructed examples · Reproducible data
Inspect the quantitative argument
These curves are calculated from the declared models. They are not observations from the cited studies. Every figure includes its numeric data and vector version.


Which evidence answers which question?
| Evidence or design choice | What it identifies | What remains unresolved |
|---|---|---|
| Source 1 | Idealized grounding-line theory identifies geometric stability conditions. | Two-dimensional assumptions and stress boundaries limit direct transfer. |
| Source 2 | Pine Island simulations explored retreat and instability. | Trajectories depend on model structure and forcing. |
| Source 3 | Satellite observations measured historical grounding-line retreat. | Observed retreat does not uniquely identify every causal contribution. |
| Primary observable | grounding-line position, discharge and thickness change | uncertain basal stress and evolving buttressing |
| Independent test | joint prediction of retreat, velocity and thickness | Requires new measurements |
| Transfer set | different shelf geometries and forcing histories | Not validated by the constructed numerical example |
A proposed validation protocol
This is a proposed evaluation design. No new biological experiment, clinical trial or physical experiment was carried out for this article.
- Specify grounding-line position, discharge and thickness change before fitting.
- Retain independent identifiers for each independent glacier sector and observation epoch.
- Separate different shelf geometries and forcing histories from model development.
- Measure or bound uncertain basal stress and evolving buttressing.
- Record units, calibration and the observation operator.
- Compare the primary model with a named rival explanation.
- Prespecify the test: joint prediction of retreat, velocity and thickness.
- Archive raw data, exclusions, parameter files and executable analysis.
What the primary sources establish
Christian Schoof · 2007 [1]
Contribution. Idealized grounding-line theory identifies geometric stability conditions.
Boundary. Two-dimensional assumptions and stress boundaries limit direct transfer.
Source locator. Abstract / selected primary-source sections; see linked bibliographic record.
L. Favier, G. Durand, S. L. Cornford et al. · 2014 [2]
Contribution. Pine Island simulations explored retreat and instability.
Boundary. Trajectories depend on model structure and forcing.
Source locator. Abstract / selected primary-source sections; see linked bibliographic record.
E. Rignot, J. Mouginot, M. Morlighem et al. · 2014 [3]
Contribution. Satellite observations measured historical grounding-line retreat.
Boundary. Observed retreat does not uniquely identify every causal contribution.
Source locator. Abstract / selected primary-source sections; see linked bibliographic record.
Limits of this analysis
- Two-dimensional assumptions and stress boundaries limit direct transfer.
- Trajectories depend on model structure and forcing.
- Observed retreat does not uniquely identify every causal contribution.
- Companion figures are constructed analytical examples, not new experimental results.
- Transfer to different shelf geometries and forcing histories has not been demonstrated by this review.
A focused narrative analysis of the named primary studies, not a systematic literature search or a claim to comprehensive coverage through 2026.
Questions that would change the conclusion
- Which observations distinguish forced retreat from self-sustaining feedback?
- How does spatial buttressing alter a local thickness-flux relation?
- Which structural uncertainties dominate forecast timing?
References
- Christian Schoof. Ice sheet grounding line dynamics: Steady states, stability, and hysteresis. Journal of Geophysical Research: Earth Surface (2007). 10.1029/2006jf000664.
- L. Favier, G. Durand, S. L. Cornford et al.. Retreat of Pine Island Glacier controlled by marine ice-sheet instability. Nature Climate Change (2014). 10.1038/nclimate2094.
- E. Rignot, J. Mouginot, M. Morlighem et al.. Widespread, rapid grounding line retreat of Pine Island, Thwaites, Smith, and Kohler glaciers, West Antarctica, from 1992 to 2011. Geophysical Research Letters (2014). 10.1002/2014gl060140.
Bibliographic identity checked against Crossref. Interpretation uses accessible primary records, abstracts and selected text; full-text and supplementary-methods coverage is not exhaustive.
Authorship and provenance
Source-based research review and original mathematical analysis written by Codex (AI). Cited experiments belong to the cited research teams.
Concept cover created with the built-in ImageGen tool. Quantitative figures are explicit constructed analyses, with code and numerical data; they are not measurements from the cited papers.
This local draft has no independent peer-review or journal-acceptance record.