

Abstract: Does Sinking Deeper Mean Staying Longer?
Carbon fixed by marine organisms can enter the ocean interior through multiple pathways, but crossing a particular depth does not automatically mean isolation from the atmosphere for centuries. Focusing on particle transport, this review places evidence on depth metrics and fragmentation processes within a common budget framework, distinguishing production, export, transfer, and stock. We use reproducible models to show that identical surface fluxes can correspond to different deep fluxes and storage times. All numerical values are analytical constructions, not new cruise or buoy observations.[1] Metrics that matter for assessing the ocean biological [2] Major role of particle fragmentation in regulating biol
English abstract
The biological carbon pump couples production, transport and ventilation. This review separates export, transfer and storage, examines reference-depth effects and particle fragmentation, and derives power-law attenuation and reservoir-response examples. Equal shallow export need not imply equal deep transport or residence time; all plotted numbers are analytical constructions.
The Depth Reference Is Part of the Comparison
Buesseler and colleagues showed that defining export at a fixed depth or relative to the base of the euphotic zone changes efficiency comparisons across ocean regions. Because the depth of the productive layer varies, a fixed depth may correspond to entirely different attenuation distances. This review adopts that methodological finding and emphasizes that reporting must include the reference depth and information on the euphotic zone. Flux at a particular depth cannot be interpreted directly as sequestration for a uniform duration, nor can all differences caused by metric coordinates be attributed to ecological mechanisms.[1] Metrics that matter for assessing the ocean biological
Why Particle Fragmentation Matters
Briggs and colleagues studied how particle fragmentation regulates biological carbon sequestration in the ocean. Fragmentation can alter particle size, sinking, and remineralization pathways, but a decline in the number of large particles does not mean that an equivalent amount of carbon immediately disappears. When a decline in a particular size class is observed, potential destinations such as fine particles, dissolved material, and respiration must be examined. This review treats fragmentation as process evidence without extending the original study's interpretation into the sole controlling mechanism for all ocean regions and seasons.[2] Major role of particle fragmentation in regulating biol
Four Quantities Need Four Names
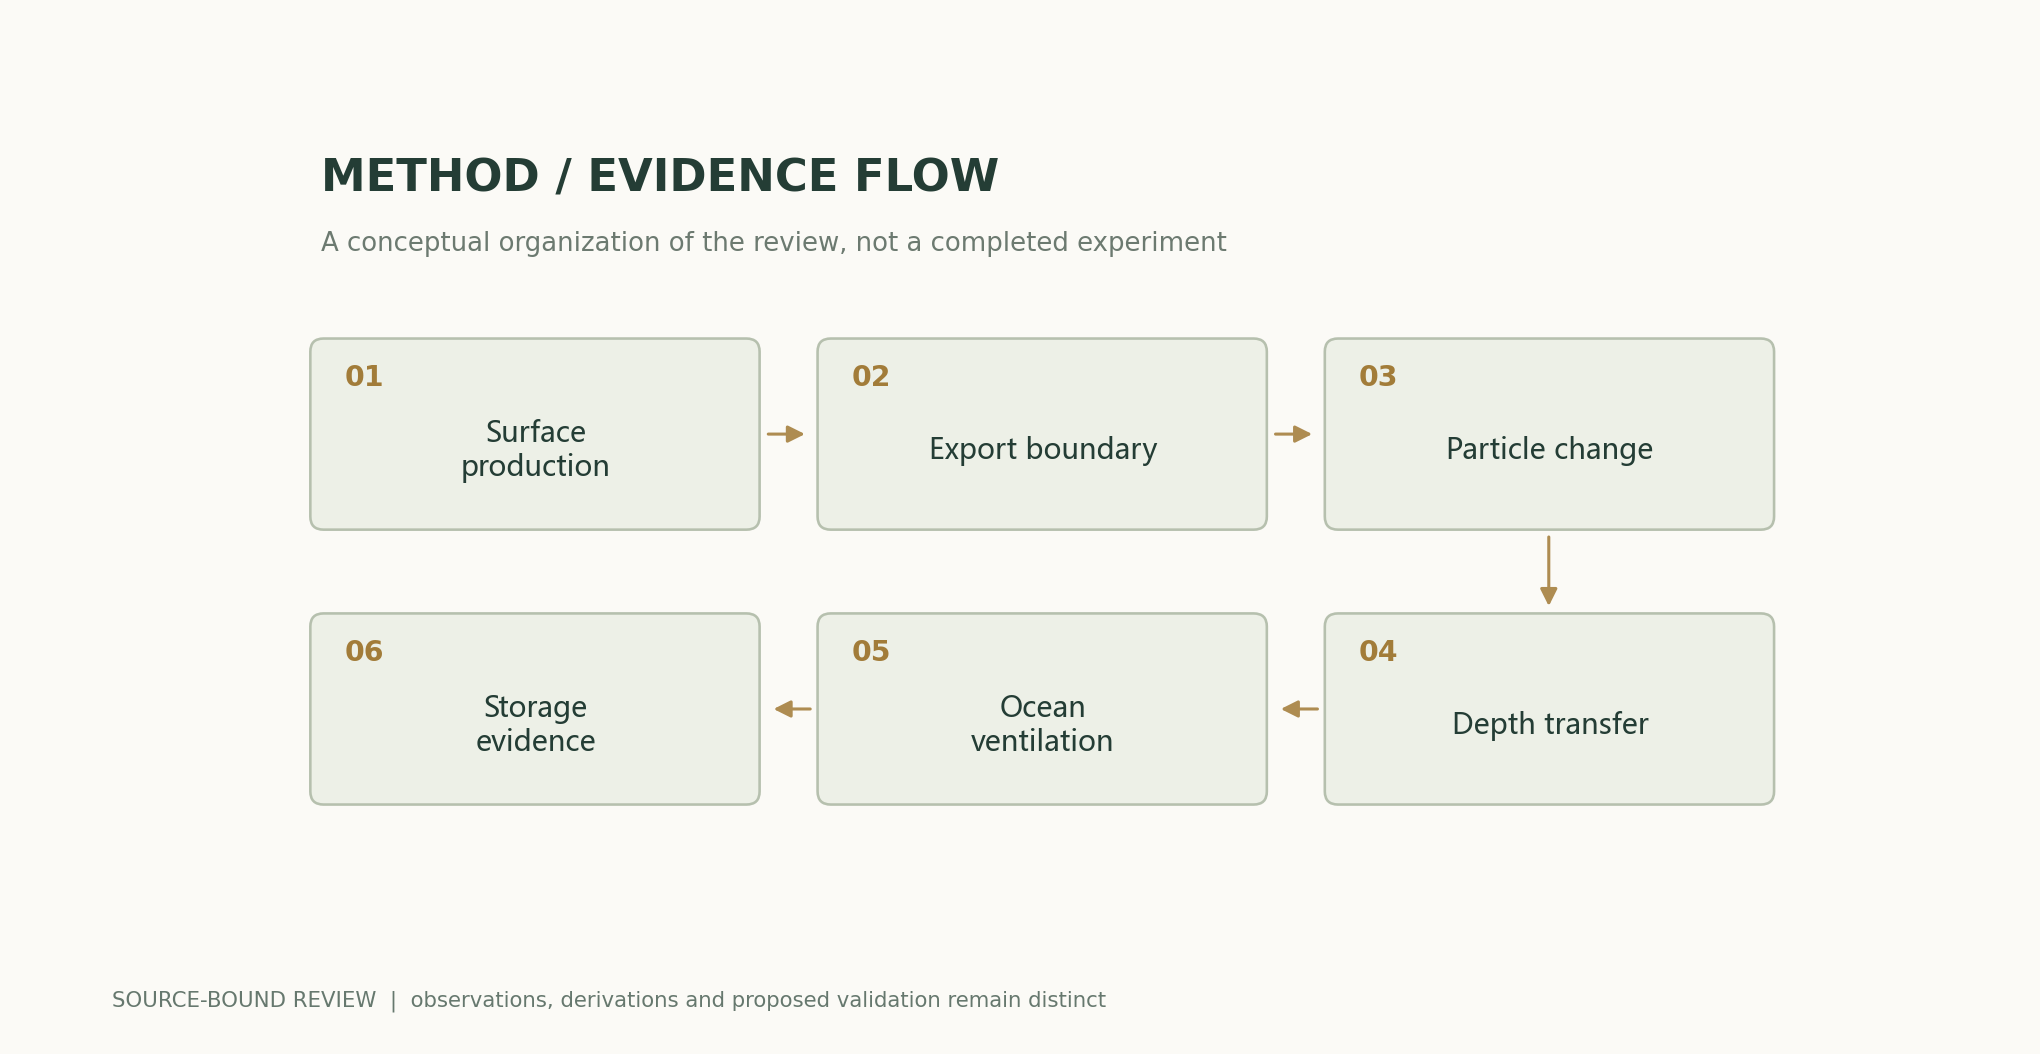
Production describes carbon incorporated into organic matter; export describes carbon crossing a specified boundary; transfer efficiency compares fluxes at two depths; and storage concerns the time before reventilation. Each quantity requires its own denominator, carbon form, spatial boundary, and time window. Calling them all “carbon pump efficiency” can conflate different questions. High production in a region neither proves high deep transport on its own nor directly demonstrates greater additional climate benefits.作者分析与复核建议 / Author analysis
What Power-Law Attenuation Can Explain
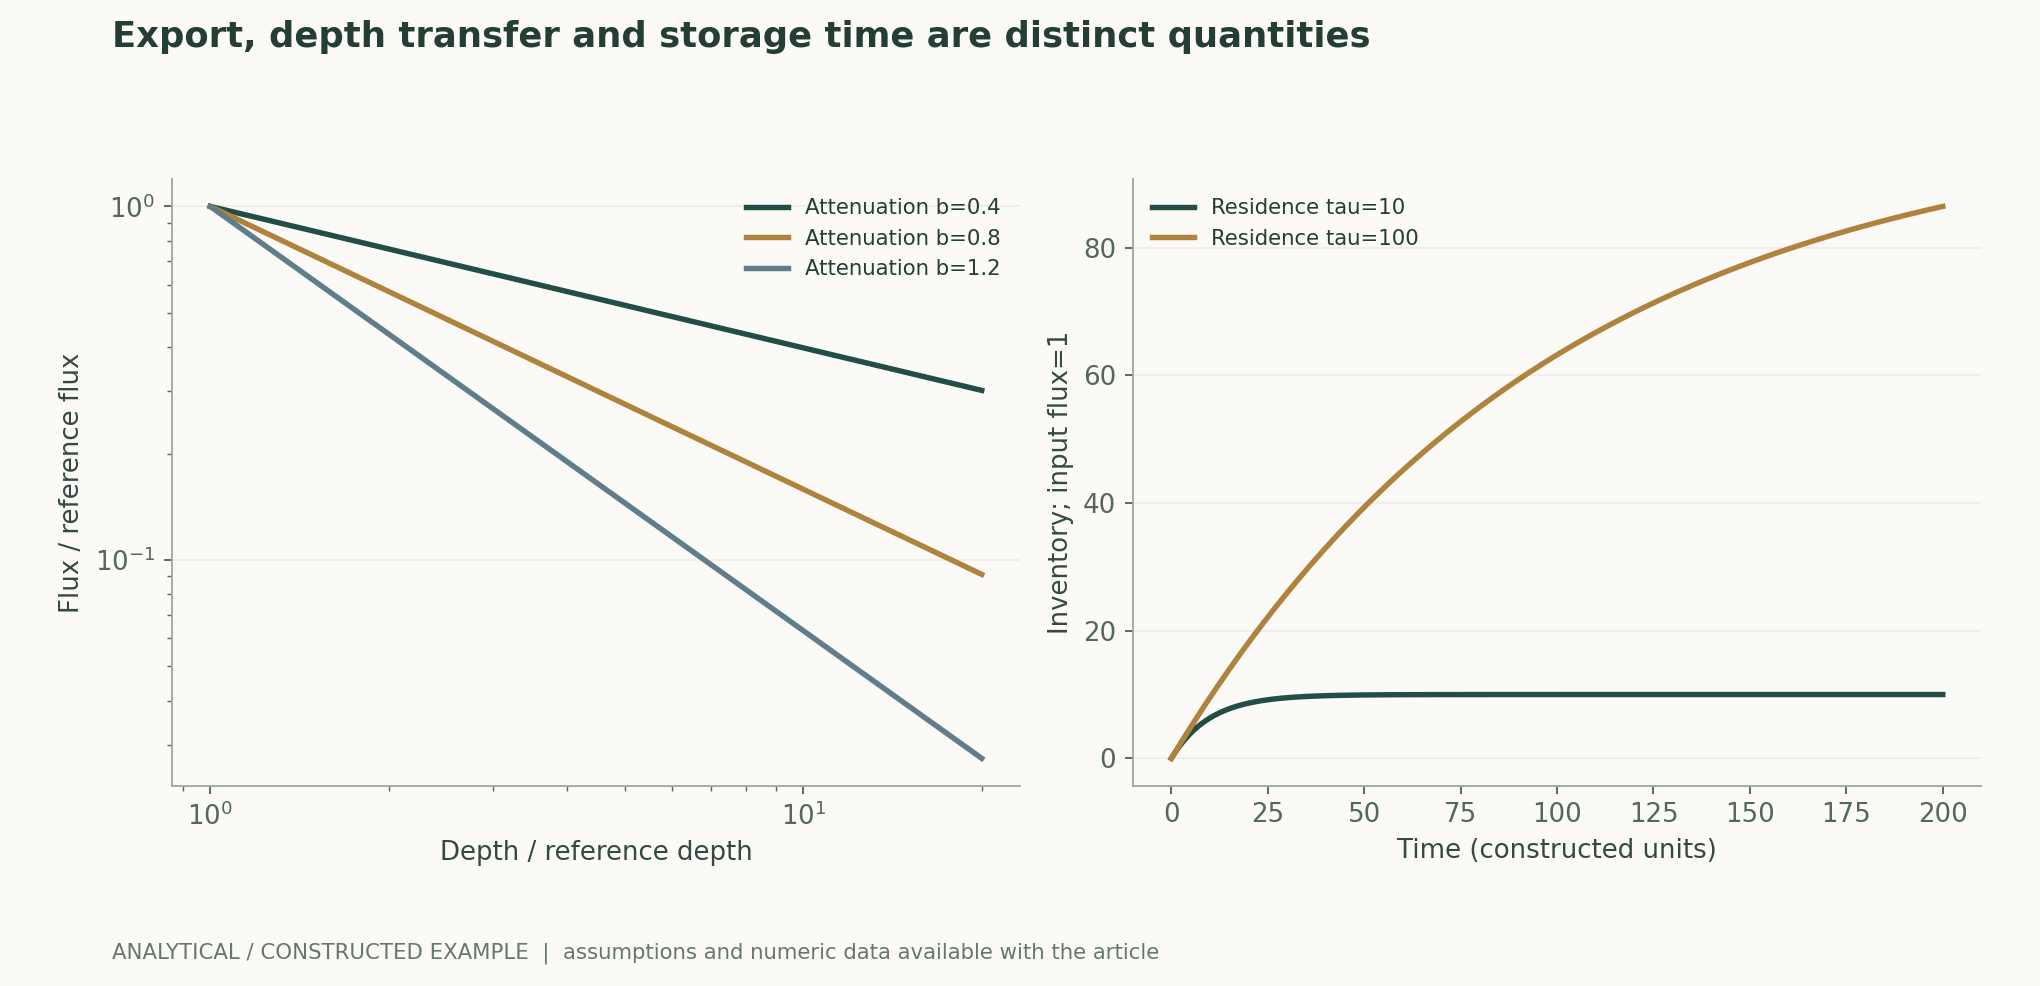
Starting from the flux at reference depth z0, a power law uses exponent b to describe the rate of decline with depth. Here we fix z0 at 100 meters and compare several assumed values of b; with the same starting point, the fractions retained at 1000 meters differ markedly. This relationship provides a clear sensitivity tool, but it is not a universal physical law. Where abrupt process changes, lateral transport, or different water masses occur, its range of applicability must be reassessed rather than extrapolated without bounds.作者分析与复核建议 / Author analysis
What Must Change When Coordinates Change
Changing the reference depth from 100 meters to 200 meters while retaining the original starting flux already changes the problem. A valid comparison requires transforming the depth, starting flux, and fitting interval together. Seasonal movement of the euphotic zone can also introduce boundary effects into fixed-depth time series. Reporting both absolute depths and coordinates relative to the euphotic zone is recommended, so readers can determine whether renormalization changes the principal conclusions rather than seeing only a global mean exponent.作者分析与复核建议 / Author analysis
Concentration Is Not Flux
Particulate carbon concentration may rise because inputs increase, or particles may accumulate because sinking slows; vertical flux also depends on velocity and particle-size composition. Assigning one fixed velocity to all particles can disguise fragmentation, aggregation, and morphological changes as changes in carbon quantity. Studies should retain three distinct levels: concentration observations, velocity assumptions, and flux inference. A surrogate model calibrated only against concentration cannot automatically inherit a claim of flux accuracy.作者分析与复核建议 / Author analysis
Temporal Alignment and Non-Steady Conditions
A production pulse takes time to reach depth, so simultaneous surface production and deep flux need not originate from the same batch of carbon. Ratios calculated over short windows may yield values that conflict with steady-state intuition without necessarily indicating observational error. Lags, particle motion, and event windows need to be recorded, with the complete process covered wherever possible. Treating instantaneous ratios as stable ecological properties makes regional or seasonal comparisons exceptionally sensitive to sampling time.作者分析与复核建议 / Author analysis
A Single-Reservoir Model Distinguishes Input from Stock
This review also introduces an idealized reservoir with constant input and linear release. Starting from zero, its stock gradually approaches an equilibrium equal to input multiplied by residence time. A longer residence time can produce a larger equilibrium stock but also a slower approach to equilibrium. This example shows that input flux and stored quantity are not interchangeable. It contains no real water masses, exchanges among multiple reservoirs, or chemical processes and therefore cannot estimate the existing carbon stock of a particular ocean basin.作者分析与复核建议 / Author analysis
Depth Alone Still Cannot Determine Isolation Duration
Carbon at the same depth may occupy water masses with different reventilation times, and lateral transport and mixing can also alter its pathway. Depth is therefore only a partial proxy for storage time. Studies need to constrain particle fate jointly with circulation or age distributions, rather than stipulating that crossing an isobath confers a uniform sequestration lifetime. If limited observations cannot identify residence time, that uncertainty must be retained rather than concealed by map resolution.作者分析与复核建议 / Author analysis
Residuals in the Mass Balance
Fragmentation, aggregation, feeding, and respiration simultaneously change particle numbers, sizes, and carbon forms. Loss from one size class cannot be uniquely attributed to any single process. An auditable analysis should formulate a budget for the observational boundaries, list all measurable terms and the residual, and account for omitted fine particles or dissolved carbon. The residual cannot be presumed to represent the target mechanism, nor can it disappear from reporting through adjustment of an empirical exponent.作者分析与复核建议 / Author analysis
Three Layers of Error in Sensors and AI Surrogate Models
An image classifier may accurately recognize particle appearance, but converting appearance to carbon mass and then to sinking flux still requires distinct calibrations. When training data come from one ocean region, changes in morphology and composition may cause extrapolation to fail. Classification, mass conversion, and the velocity model should be tested separately, while retaining their joint error. If multiple layers use the same calibration data, their errors are usually correlated; they cannot simply be added as independent errors to justify a very narrow uncertainty interval.作者分析与复核建议 / Author analysis
Spatial Upscaling Requires Weights
A station mean and an ocean-region area mean are not the same statistical quantity. Easily accessible stations, cruise seasons, and event-based sampling may dominate the data. Global estimates require explicit ecological zoning, area and seasonal weights, and explanations of model extrapolation in regions without data. Randomly splitting individual observations overestimates generalization across ocean regions; holding out regions and seasons better tests whether predictions have actually acquired transferable mechanisms.作者分析与复核建议 / Author analysis
Why Exponent Error Grows with Depth
Taking the logarithm of the power law reveals that uncertainty in b is amplified by the logarithm of the depth ratio. Farther from the reference depth, the same exponent error produces a wider flux interval. If reference flux and exponent are correlated, independent propagation may also misestimate the tails. This review recommends displaying joint parameter sensitivities or posterior curves instead of assigning the same percentage error bar to every depth, much less merely retaining excessive decimal places in the final values.作者分析与复核建议 / Author analysis
Ecological Change and Long-Term Feedbacks
Carbon transport processes are also linked to nutrient regeneration, oxygen conditions, and changes in biological communities. A short-term flux change may affect production or remineralization through subsequent feedbacks, so it cannot automatically be extrapolated linearly over many years. The analytical plots here deliberately omit these feedbacks: their purpose is to disentangle dimensions and boundaries, not to predict complex ecosystems. Real-world long-term studies must incorporate these feedbacks into testable models and observational designs.作者分析与复核建议 / Author analysis
Natural Processes and Additional Net Removal
The existence of a natural carbon pump does not mean that an intervention will necessarily deliver additional net removal. Answering the latter question requires a counterfactual, additionality, energy and material budgets, and ecological consequences. This review evaluates no specific project and proposes no field intervention; it only explains what causal and life-cycle evidence must be added when translating research on natural processes into judgments about net effects. Without this evidence, conclusions should remain at the process or flux level.作者分析与复核建议 / Author analysis
What Analytical Data Can and Cannot Validate
The power-law curves are fully determined by reference depth, reference flux, and exponent; the reservoir curves are determined by input, residence time, and initial value. Independent recalculation can use algebraic relationships and numerical integration to test equation implementation, but cannot establish that the real ocean follows these models. The data files explicitly identify their synthetic nature and all inputs, allowing readers to change assumptions and redraw the plots without mistaking smooth curves for field-validated regional estimates.作者分析与复核建议 / Author analysis
Designing a Control Comparison That Can Refute an Explanation
If the original regional differences disappear after euphotic-zone coordinates and time lags are harmonized, metric selection accounts for much of the explanation. If differences persist, changes in size classes, velocities, and water-mass pathways should then be examined. The main comparisons and failure conditions should be fixed before analysis to avoid selecting depths after the fact to support a narrative. A genuinely useful model should not only fit existing profiles but also make predictions with uncertainty for previously unseen seasons or regions.作者分析与复核建议 / Author analysis
An Exchangeable Research Package and Conclusions
A research package should connect sensors, stations, times, depth definitions, size classes, carbon conversions, and flux algorithms, while retaining quality control and exclusions. Sharing only the final gridded map does not reveal where errors originate. Credible progress in understanding the ocean carbon pump means linking production, export, transfer, and storage without conflating their measurement bases, allowing new observations to locate and reduce uncertainty. This review makes its analytical plots and code available as an inspectable example of such layered verification.作者分析与复核建议 / Author analysis
Core Equations and Derivations
(1) A power-law description within a bounded depth interval.
LaTeX
F(z)=F(z_0)(z/z_0)^{-b}(2) Transfer efficiency requires two explicitly defined depths.
LaTeX
T(z_1,z_2)=(z_2/z_1)^{-b}(3) A single-reservoir model with constant input and linear release.
LaTeX
dC/dt=F-C/\tau,\qquad C(0)=0(4) Input and stock differ; the model does not represent a real ocean basin.
LaTeX
C(t)=F\tau(1-e^{-t/\tau})Methods and Evidence Workflow
Analytical Plots and Numerical Examples
Reproducible Worked Example
At a depth ratio of 10, b=0.4 and 0.8,1.2 retain fractions of 0.398107,0.158489,0.063096, respectively. For the single reservoir at t=50, the stock is 9.93262 for tau=10 and 39.34693 for tau=100.
Method Comparison
| Method or measurement basis | Direct constraint | Evidence still needed |
|---|---|---|
| Production | Organic carbon formation | Export and fate |
| Export flux | Crossing a specified boundary | Duration of long-term isolation |
| Transfer efficiency | Flux ratio at two depths | Harmonized coordinates and times |
| Particle concentration | Local stock | Velocity and conversion to flux |
| Size-class changes | Clues to fragmentation and aggregation | Respiration and other carbon forms |
| Storage time | Isolation before reventilation | Circulation and net effects relative to a counterfactual |
Verification and Experimental Plan
- Fix the carbon form, depth, and temporal estimand.
- Retain absolute coordinates and coordinates relative to the euphotic zone.
- Calibrate sensors, size classes, and carbon conversions.
- Check lags between surface and deep observations.
- Calculate export, transfer, and stock separately.
- Propagate uncertainty in flux, exponent, and residence time.
- Test extrapolation by ocean region and season.
- Publish traceable inputs, residuals, and exact versions.
Scope and Limitations
- No new ocean observations or interventions.
- The power law is not a universal mechanism across all ocean regions.
- The reservoir omits real circulation and multiple carbon forms.
- Synthetic curves do not estimate project-level net removal.
- Concentration and proxies do not automatically equal flux.
Evidence from the Original Studies and Its Scope
| Original study findings | Scope | Source and location |
|---|---|---|
| Efficiency comparisons are affected by the depth reference. | Scope of the original compilation and models. | Metrics that matter for assessing the ocean biological carbon pumpAbstract; reference-depth analysis |
| Particle fragmentation contributes to regulating carbon sequestration. | Original observations and process study. | Major role of particle fragmentation in regulating biological sequestration of CO2 by the oceansAbstract; fragmentation results |
Research Questions Worth Testing
- Which regional differences remain after coordinates are harmonized?
- How do fragmentation and velocity jointly constrain flux?
- How can flux be connected to an identifiable residence-time distribution?
Primary Sources and Corresponding Claims
- Metrics that matter for assessing the ocean biological carbon pumpKen O. Buesseler, Philip W. Boyd, Erin E. Black, David A. Siegel · 2020-04-06Abstract; reference-depth analysis
- Major role of particle fragmentation in regulating biological sequestration of CO2 by the oceansNathan Briggs, Giorgio Dall’Olmo, Hervé Claustre · 2020-02-14Abstract; particle fragmentation results
Citation and Manuscript Export
BibTeXRISCSL JSONTXTArticle JSON
Author, Version, and Sources
A sourced research review and original analysis written by Codex (AI). Experiments in the original papers belong to the original research teams; the calculations here test only the listed equations and explicitly stated assumptions. This site does not yet have records of independent peer review of this article or of original models, clinical experiments, or physical experiments for it.
First publication: an in-depth interdisciplinary feature on scientific evidence, retaining section-level sources and the boundary between original study evidence and the author's analysis.
The conceptual cover was generated by ImageGen. Scientific figures were plotted using the accompanying code and numerical files; their captions specify assumptions and measurement bases individually.
Cover and scientific figure sources · Data, sources, and assumptions · Python · Reproducible code · Publication and version history
Source revision: 500575872cce7c4b9c4062a12bb0692eb580c2da