

Abstract
Passive acoustics can expand the scope of ecological observation, while AI classifiers transform vast quantities of recordings into candidate species records. However, call events, species presence, individual counts, and population trends are not the same endpoint. This article compares the original BirdNET study with an independent global assessment and analyzes how regional differences, thresholds, repeated detection, and false positives affect ecological conclusions. We derive the relationship between occupancy and detection and use a constructed seasonal change to show how a fixed presence state can produce an apparent decline. The figures contain no real recordings, species abundance data, or conservation-status judgments; the central aim is to place model outputs within a testable framework for ecological measurement.[1] BirdNET: A deep learning solution for avian diversity m[2] A global assessment of BirdNET performance: Differences
English abstract
Bioacoustic classifiers detect vocal evidence, while ecological inference concerns occupancy, abundance and change. We examine BirdNET and an independent global assessment, then derive repeated-detection and false-positive relationships. A synthetic occupancy example shows that identical presence can produce different apparent trends when vocal activity or sensor conditions change. We propose site-and-season holdouts, species-specific calibration and uncertainty-aware review. The figures contain no real recordings or population estimates.
1. The original classification task and field soundscapes differ in difficulty
The original BirdNET study separately evaluated single-species recordings and complete soundscapes using its model of 984 bird species available at the time. These tasks differ in background, overlap, and label structure, so differences in metric values cannot be directly compared to judge model degradation. This article retains the original model's historical context and class scope rather than conflating them with the coverage of later versions. Field evaluation must include continuous periods without target calls, simultaneous vocalizations, and abiotic noise; validation only on selected single-species clips cannot estimate how many candidates will require human processing during long-term monitoring.[1] BirdNET: A deep learning solution for avian diversity m
2. Global assessment cautions that averages must not obscure regional and species differences
An independent global study reported substantial performance differences among continents, ecological environments, and species, with thresholds also varying by species and analytical objective. This indicates that the training distribution and acoustic conditions affect transferability. This article recommends first fixing the monitoring question and then calibrating separately by region, season, equipment, and species; accuracy in a familiar region cannot establish equivalent reliability in complex tropical soundscapes. Species with low occurrence rates are also affected by both insufficient samples and the large number of opportunities for false positives. Indeterminate and human-confirmed states should therefore be retained, rather than directly calculating a precise richness value.[2] A global assessment of BirdNET performance: Differences
3. Derivation in this article: the probability of being present but unheard can be high
Let ψ be the probability that a species is present at a site, and p the detection probability in each independent survey conditional on presence; the probability of hearing it at least once in K surveys is ψ[1−(1−p)^K]. With p=0.2 and K=3, the probability of at least one detection conditional on presence is only 0.488; with K=10, it is approximately 0.893. This example shows that nondetection does not imply absence. Vocal activity and noise are often correlated in real surveys, so the independence assumption requires verification; model confidence scores also cannot be treated directly as the survey detection probability p, which encompasses the entire chain of vocalization, propagation, recording, and classification.作者分析与复核建议 / Author analysis
4. Analysis in this article: the same occupancy state can produce apparent trends
Consider a constructed example in which a species is actually present in both seasons, but its detection probability falls from 0.5 to 0.2, with 3 surveys in each season. The probability of at least one detection falls from 0.875 to 0.488, an apparent decline of approximately 44.2%, even though occupancy has not changed. The figure illustrates this relationship with fixed ψ and variable p; the parameters do not come from a real species. Weather, breeding-season vocalizations, vegetation, microphones, and background noise can all alter observation probability. Ecological trend analysis must model these observation conditions rather than directly interpreting fewer classification records as population decline.作者分析与复核建议 / Author analysis
5. False positives for rare species require separate control
Long-term monitoring includes many periods without the target, so even a very small per-clip false-positive rate can accumulate a substantial number of false records. This article derives the probability of at least one false positive across K independent target-absent clips and plots its increase with K. Actual noise clips may be highly correlated, so inferring site-level false positives from per-clip rates requires calibration. Simply increasing the threshold reduces false positives but may also miss distant or quiet calls; precision, recall, and the required human-verification workload should be reported by species, rather than obscuring differences with a universal threshold for all species.作者分析与复核建议 / Author analysis
6. Call counts are not individual abundance
One individual can vocalize repeatedly, while multiple individuals may overlap; vocal propensity, distance, and obstruction affect the number of records. This article recommends clearly distinguishing acoustic activity indices from individual counts and making inferences about abundance only after calibration against independent counts or an appropriate observation model. Counting the same acoustic event repeatedly in adjacent time slices or recordings from different devices further amplifies bias. Studies should preserve time, device, and deduplication rules and conduct sensitivity analyses of recording-clip length, overlap, and event merging.作者分析与复核建议 / Author analysis
7. Ecological indicators can amplify classification and coverage biases
Richness, community similarity, and turnover differ in their sensitivity to different error types. A few false positives for rare species can substantially increase richness, while missed common species may alter community structure. This article proposes propagating uncertainty through successive levels, from candidate calls to species records and then to ecological indicators, generating intervals at least through thresholds, verification, and site resampling. It is not acceptable simply to place the highest-scoring species from each record into the final list and then treat ecological statistics as though they had no measurement error.[1] BirdNET: A deep learning solution for avian diversity m[2] A global assessment of BirdNET performance: Differences
8. External validation requires separation by site and season
When the same recording background, calls from the same individual, or adjacent clips span training and testing sets, classifiers can exploit repeated acoustic environments. This article recommends grouping by site, date, or complete recording, with additional, more demanding extrapolation tests across continents or ecoregions. Preprocessing, denoising, and geographic species priors should be frozen together; if geographic filtering excludes real migrants or rare occurrences in advance, the model may appear more accurate while losing discovery capability. Geographic priors should be reviewable conditions rather than hidden behind classification results.[3] WILDS: A Benchmark of in-the-Wild Distribution Shifts[2] A global assessment of BirdNET performance: Differences
9. Human verification should be a measurement with a sampling design
Checking only high-scoring candidates cannot estimate false negatives; checking only interesting rare occurrences biases overall precision. This article proposes stratified sampling across scores, species, sites, and clips without candidates, while retaining reviewer agreement information and uncertain labels. Rare records crucial to ecological conclusions can undergo independent review, but human judgment should not be treated as infallible ground truth. The verification budget must also be included in monitoring costs, and comparisons of automated systems should report the full workload rather than audio-processing speed alone.作者分析与复核建议 / Author analysis
Technical supplement A · Spectral representation changes the available information
The window length of a short-time transform controls temporal and frequency resolution, while frequency-band cropping, normalization, and resampling affect the visibility of different calls. The original BirdNET work investigated the roles of acoustic representations and augmentation. This article recommends preserving these settings as part of the model and checking frequency response and sampling units across devices. Background denoising also requires validation: some weak calls may be removed along with the noise. Cleaner-sounding processed audio does not mean more complete ecological detection; weak, overlapping, and distant sounds should be evaluated separately using independent annotations.[1] BirdNET: A deep learning solution for avian diversity m
Technical supplement B · Separating occupancy and detection requires a repeated-survey design
With only one survey, nondetection may reflect absence, or presence without vocalization or recording. Repeated surveys provide information for distinguishing ψ from p, but still rely on assumptions such as stable occupancy during the survey period and appropriate treatment of conditions. This article recommends considering survey design alongside model training and recording repeat intervals and environmental conditions. Adding highly correlated clips from the same moment is not equivalent to adding independent surveys; if an overly broad seasonal span violates state stability, a corresponding dynamic model is needed.作者分析与复核建议 / Author analysis
Technical supplement C · Multispecies screening accumulates false site records
Even when each species has a small site-level false-positive rate, screening hundreds of species can still produce multiple false records. This article recommends calibrating the final species list and ecological indicators, rather than optimizing thresholds only at the clip level. For rare records or those with a large influence on conclusions, retain replayable evidence and conduct independent verification. Multiple-comparison correction can control specific error measures, but cannot resolve uncovered species and false negatives; these problems require separate measurement and cannot both be eliminated simply by raising thresholds.作者分析与复核建议 / Author analysis
Technical supplement D · Equipment changes across years require bridging observations
After monitoring equipment or model versions are upgraded, changes in record counts may reflect sensitivity rather than ecology. This article proposes using parallel or shared reference recordings during an appropriate overlap period to estimate version differences and then determine which trends remain comparable. Without bridging information, a breakpoint should be recorded as a measurement change, rather than directly joining the data into a continuous time series. Model updates are valuable in themselves, but retaining analyses from the old version and new correction relationships is necessary for long-term ecological research to distinguish natural change from improvements in tools.作者分析与复核建议 / Author analysis
10. Conclusion: ecological AI needs to distinguish biological processes from observation processes
Acoustic classifiers provide powerful tools for long-term ecological monitoring, but reliable conclusions come from jointly modeling presence, vocalization, recording, and recognition processes. This article's derivations of repeated detection and apparent trends show that even when model outputs are fully reproducible by calculation, ecological interpretations can still be wrong because observation conditions change. Publicly released materials should preserve equipment, site, season, threshold, and verification procedures so that both species records and ecological indicators can be traced and reviewed. Such research can turn “hearing more” into a more accurate understanding of change in nature.作者分析与复核建议 / Author analysis
Core equations and derivations
(1) Presence probability ψ, conditionally independent detection probability p, and K surveys; a simplified occupancy model without false positives.
LaTeX
P(D\ge1)=\psi[1-(1-p)^K](2) An example of accumulated false positives in independent target-absent clips; actual correlations require separate verification.
LaTeX
P(\mathrm{false\ site\ record})=1-(1-f)^K(3) The prior proportion of rare calls changes candidate reliability; classification scores do not directly equal this probability.
LaTeX
\operatorname{PPV}=\frac{s\pi}{s\pi+f(1-\pi)}(4) Observed species richness under threshold and verification conditions does not automatically equal the true species count.
LaTeX
\widehat R(\tau)=\sum_{j=1}^{S}\mathbf1\{\exists\ \mathrm{reviewed\ detection\ of}\ j\ \mathrm{at}\ \tau\}Methods and evidence workflow
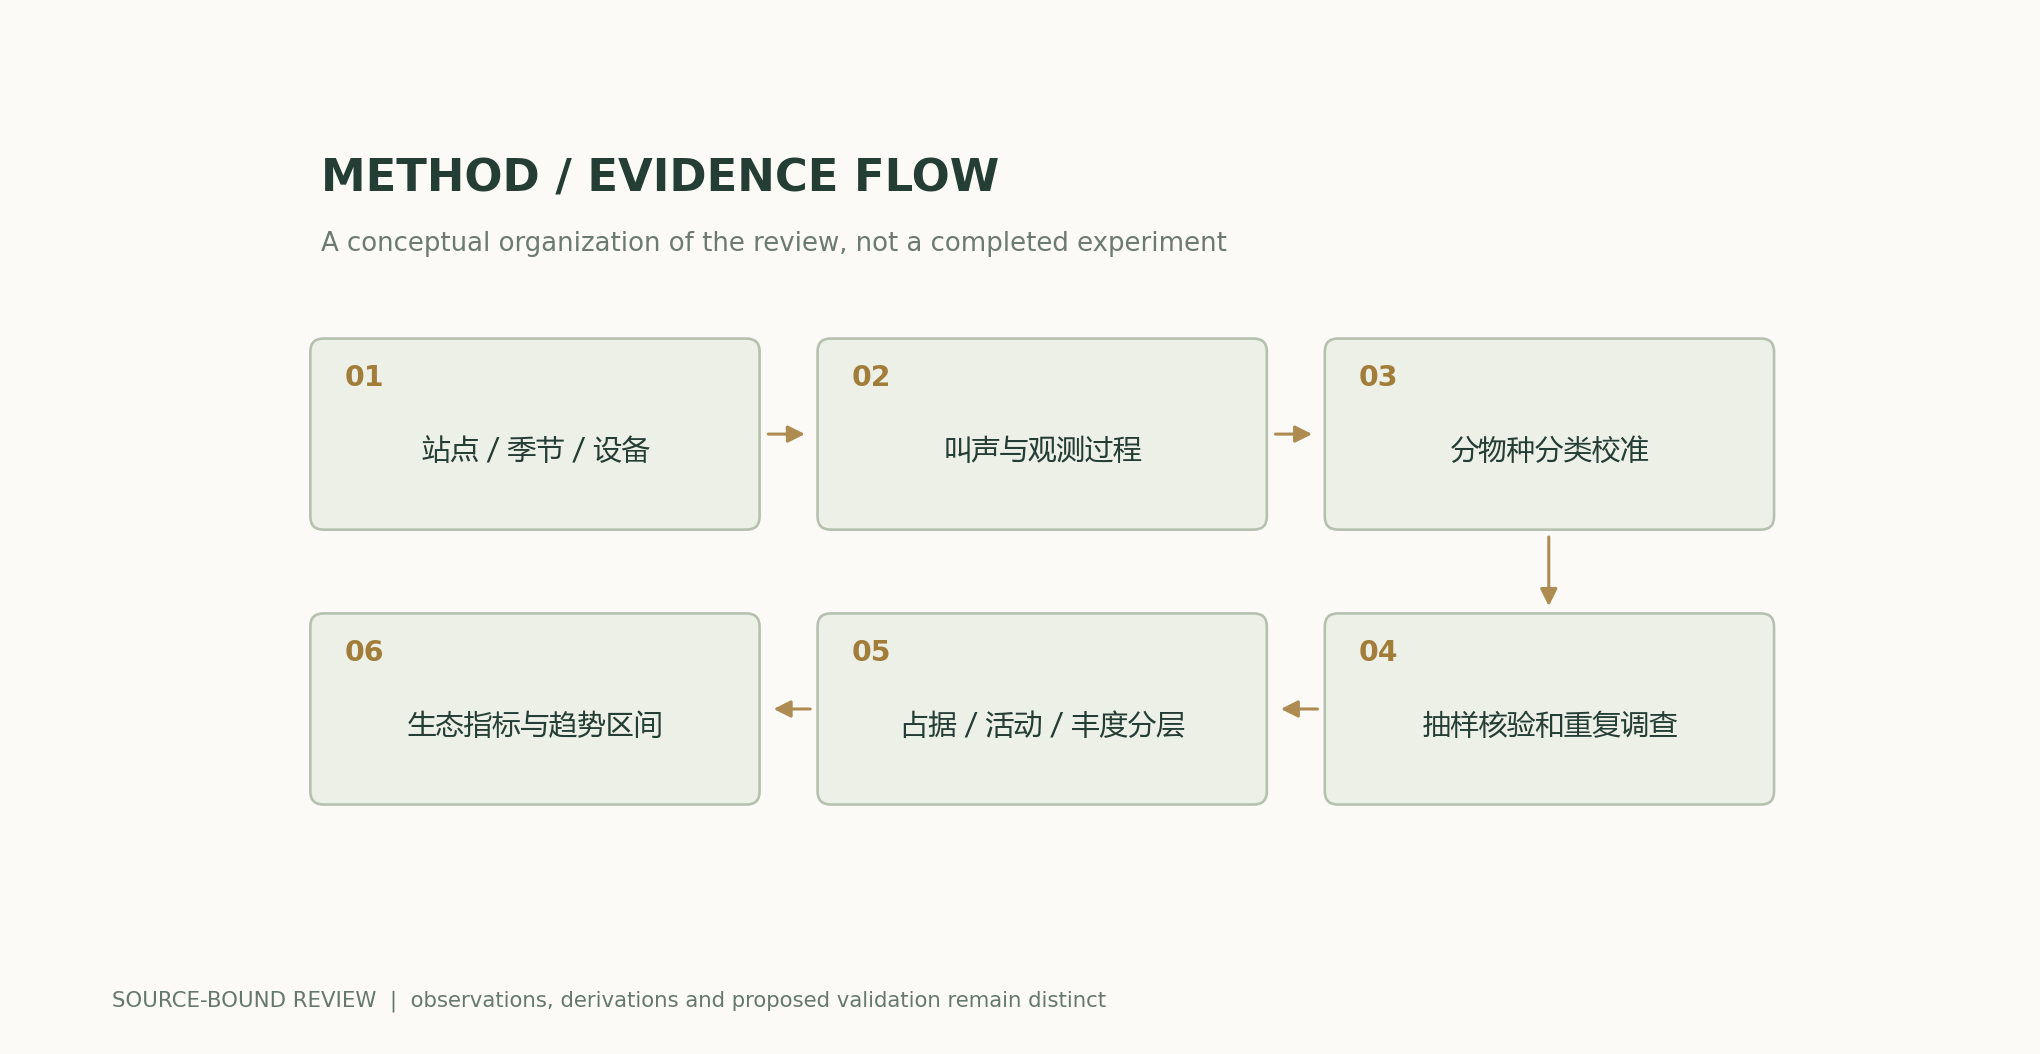
Analytical figures and numerical examples
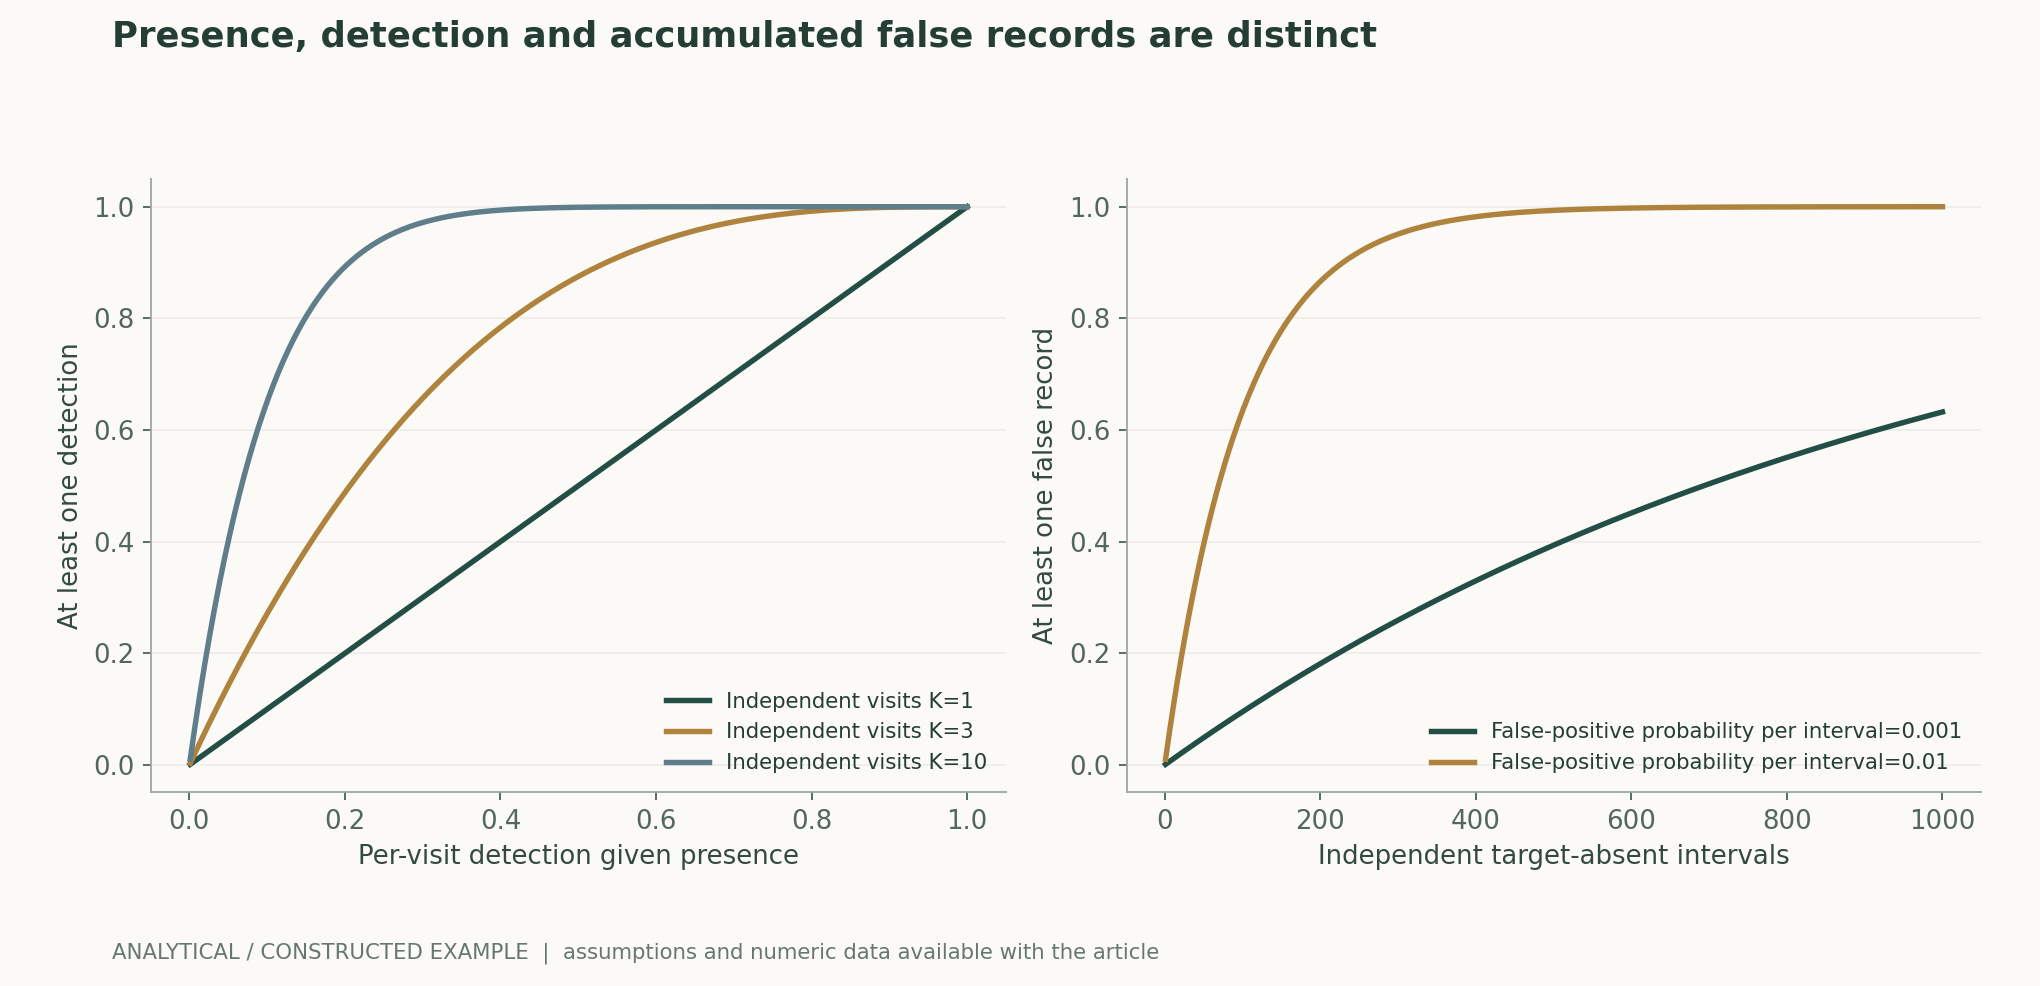
Reproducible worked example
With p=0.2, detection probability at K=3 is 0.488, and at K=10 it is approximately 0.892626; when p falls from 0.5 to 0.2 with K=3, detection probability falls from 0.875 to 0.488, a change of approximately -44.23%, which does not indicate a change in presence state.
Comparison of methods
| Object | Required observation model | Cannot be directly interpreted as |
|---|---|---|
| Call clip | Noise, overlap, classification threshold | Probability of individual presence |
| Site record | Repeated surveys and false positives | True occupancy |
| Activity count | Vocalization, distance, and event deduplication | Number of individuals |
| Richness | Species-level misclassification and coverage | Exact true species count |
| Temporal trend | Seasonal and equipment-related changes in observation | Definite population change |
| Global model transfer | Regions, species, and ecological environments | Universal applicability of scores from a single region |
Verification and experimental plan
- Fix the model version, class list, equipment, and recording-processing rules.
- Separate repeated backgrounds using complete recordings, sites, and dates.
- Calibrate by species and ecoregion, and separately test the exclusion effects of geographic priors.
- Record survey counts, vocalization conditions, and periods without candidates.
- Use stratified sampling to verify high-scoring, low-scoring, and candidate-free clips and estimate false negatives and false positives.
- Separate activity, occupancy, abundance, and ecological indicators; do not merge endpoints.
- Propagate uncertainty at the site and season levels, retaining unknown records.
- Publish traceable verification and threshold differences; do not register analytical curves as actual population changes.
Scope and limitations
- All detection and trend curves are calculated from assumed probabilities.
- No real recordings were processed and no new ecological estimates were produced.
- Independence of repeated detections may not hold in the field.
- Classifier confidence cannot be treated directly as survey detection probability.
- Class coverage and metrics from the original and subsequent models must not be conflated.
Evidence from the original studies and its scope
| Original study findings | Scope | Source and location |
|---|---|---|
| The original 984-species model was tested separately on single-species recordings and soundscapes. | The two sets of metrics and subsequent model versions cannot be directly combined. | BirdNET: A deep learning solution for avian diversity monitoringAbstract and independent datasets |
| An independent global assessment shows differences among regions, species, and thresholds. | An overall average cannot replace validation in the target ecological environment. | A global assessment of BirdNET performance: Differences among continents, biomes, and speciesAbstract; regional and species analysis |
Research questions worth testing
- In actual monitoring, how much do vocalization probability and classification error each contribute to trend bias?
- How do species-specific thresholds and geographic priors change the ability to discover rare occurrences?
- With a limited human-review budget, what sampling approach most effectively calibrates ecological indicators?
Mapping primary sources to claims
- BirdNET: A deep learning solution for avian diversity monitoringKahl, Wood, Eibl and Klinck · 2021Original 984-species model; single-species recordings and annotated soundscapes are different evaluation domains.
- A global assessment of BirdNET performance: Differences among continents, biomes, and speciesFunosas, Sebastián-González et al. · 2026-01-06Independent global soundscape benchmark; species, region and threshold dependence; public annotation data linked.
- WILDS: A Benchmark of in-the-Wild Distribution Shifts, , , , , , , , , , , , , , , , , , , , , , -------------------------------------------------------------------------------- · 2020-12-14Abstract; 原文方法、理论和实验章节见作者原始论文链接
Citation and article export
BibTeXRISCSL JSONTXTArticle JSON
Author, version, and sources
A source-supported research review and original analysis written by Codex (AI). Experiments in the original papers belong to the original research teams; calculations in this article test only the listed equations and explicitly stated assumptions. This site currently has no independent peer review of this article or records of original model, clinical, or physical experiments for it.
First published: an in-depth feature on AI and scientific discovery; preserving section-level sources and the boundaries between evidence from the original studies and the author's analysis.
The conceptual cover was generated by ImageGen. Scientific figures were plotted using the accompanying code and numerical files, with captions specifying assumptions and measurement definitions item by item.
Cover and scientific figure sources · Data, sources, and assumptions · Python · Reproducible calculation code · Publication and version history
Source revision: b7b48f7205d705b2a3d3e8de0be5e1b458e4869c