

Abstract: One Efficiency Metric Cannot Represent the Entire Process
Carbon dioxide electrolysis can link electrical energy to carbon conversion, but calling it “efficient” requires answers to at least three questions: where did the charge go, where did the feed carbon go, and how much energy was consumed after separation was completed? This article connects alkaline copper interface catalysis with research on multicarbon products in strong acid, examining catalytic selectivity, the carbonate pathway, full-cell voltage, and recycling and separation. Analytical models show that Faradaic efficiency, single-pass carbon utilization, and system energy efficiency cannot substitute for one another, nor can a single highest value establish net emissions reductions.[1] CO2 electroreduction to ethylene via hydroxide-mediated[2] CO2 electrolysis to multicarbon products in strong acid
English abstract
CO2 electrolysis must close charge, carbon and energy balances simultaneously. We compare alkaline interface catalysis with strong-acid conversion, distinguish Faradaic selectivity from feed-carbon utilization, and derive product-specific electrical energy and recycle examples. The framework exposes why a catalyst-level improvement need not survive at complete-system scale.
Contributions of Alkaline Interface Research
Dinh and colleagues investigated the conversion of carbon dioxide to ethylene through copper catalyst and reaction-interface design, providing evidence on local chemical environments, selectivity, and operational stability. This article retains the original electrode and test conditions: it does not equate potential relative to a reference electrode with full-cell voltage, or recast selectivity within a particular operating window as overall efficiency encompassing separation, recycling, and all auxiliary equipment.[1] CO2 electroreduction to ethylene via hydroxide-mediated
Which Constraint Does the Strong-Acid Route Change?
Research on strong-acid electrolysis addresses carbonate formation and limitations on carbon utilization in neutral and alkaline systems, while still facing competing processes such as hydrogen evolution. It shows that changing the electrolysis environment can redistribute system losses rather than eliminate all costs. This article focuses on how different pathways can be compared within the same carbon and charge boundaries; it does not automatically interpret avoidance of one loss as universal optimality across all products, scales, and operating conditions.[2] CO2 electrolysis to multicarbon products in strong acid
Charge Balance Defines Faradaic Efficiency
Faradaic efficiency compares the number of electrons corresponding to formation of a particular product with the total charge passed. Electron stoichiometry differs among products, and measurements in the gas and liquid phases must also align with time integration. If collection covers only some outlets, efficiency may be miscalculated. A complete report should present all major products and unaccounted-for charge, rather than only the highest value for the target product; good charge closure still does not establish closure of carbon or energy balances.作者分析与复核建议 / Author analysis
Carbon Utilization Uses a Different Denominator
Single-pass carbon utilization concerns how much feed carbon enters the target product, rather than where the electrons go. Large amounts of unreacted feed, conversion to carbonate, or departure through other outlets can all lead to very low carbon utilization, even when the target product has relatively high Faradaic efficiency. Studies need to account for all outlets on a carbon-atom basis, explicitly identifying dissolved carbon, crossover, and carbon stored in the system; changes in gas inlet flow must not be treated directly as conversion.作者分析与复核建议 / Author analysis
Full-Cell Voltage Determines the Electrical Energy Ledger
Calculating energy consumption from the cathode potential relative to a reference electrode omits anode, membrane, and ohmic losses. System electrical energy requires integrating the product of full-cell voltage and current over time, then dividing by the amount of ultimately deliverable product. This article calculates ideal electrical energy for ethylene using explicit electron stoichiometry and molar mass, varying full-cell voltage and Faradaic efficiency in the figure. All parameters are constructed values and do not represent actual energy consumption in the original papers or industrial equipment.作者分析与复核建议 / Author analysis
Unit Conversions Can Also Manufacture Records
Values per mole, per kilogram, per tonne, and per unit of carbon cannot be compared directly; lower and higher heating values and chemical free energy also serve different purposes. Studies should retain the original dimensions and conversion constants; in particular, feed calculations for multicarbon products must account for the number of carbon atoms. If energy consumption includes only electrolysis and excludes separation, the boundary should be explicit: use of the same unit must not mislead readers into assuming coverage of an entire plant.作者分析与复核建议 / Author analysis
Current Density and the Local Environment
Increasing current density can raise production rates, but it also changes mass transport, local acidity and alkalinity, temperature, and the interfacial state. Catalyst selectivity at low current does not guarantee its retention at high throughput. Actual reaction area and geometric area should be recorded, distinguishing intrinsic material activity from electrode structure. If comparisons use different electrolyzers, observed differences may arise mainly from mass transport and reactor design rather than the active sites themselves.作者分析与复核建议 / Author analysis
Gas Diffusion and Wetting State
The stability of the gas–liquid–solid interface affects reactant arrival and product removal. Flooding, drying, or salt accumulation may alter the effective area over time, preventing initial performance from being sustained. Studies need to track selectivity, full-cell voltage, flow rates, and operating interruptions synchronously. Reporting only hours of stable operation without explaining whether output changed can conceal performance degradation; recovery after restarting should also be recorded separately from continuous operation.作者分析与复核建议 / Author analysis
Recycling Does Not Replenish Losses for Free
Recovering unconverted carbon dioxide and returning it to the reactor can increase overall utilization, but requires separation and compression and is affected by losses in each cycle. This article uses a geometric series with fixed single-pass conversion u and recovery fraction r to illustrate how overall utilization changes. Only the unreacted, recoverable fraction participates in recycling; carbon already incorporated into unrecoverable carbonate or byproducts cannot be replenished in the same way. A real process also requires an explicit mass-flow model.作者分析与复核建议 / Author analysis
Product Purity and Separation Burden
Producing the target molecule is not equivalent to obtaining a product that meets specifications. Low-concentration liquid products, mixed gases, or dissolved carbon may require substantial separation energy. Different systems may have different outlet concentrations even at the same Faradaic efficiency. Comparative studies should specify target purity, recovery, and separation boundaries; they must not directly rank energy consumption when one method includes separation and another includes only electrolysis.作者分析与复核建议 / Author analysis
Carbon Sources and End Uses
Using carbon dioxide does not automatically constitute permanent removal. If a product is ultimately burned as fuel, its carbon may return to the atmosphere; if it displaces another production route, its effect requires a counterfactual comparison. The carbon intensity of energy, carbon dioxide capture, and transport also enter the assessment. This article does not claim that any process has achieved net-negative emissions; it requires only that arguments extending from materials to systems make end uses and life-cycle boundaries explicit.作者分析与复核建议 / Author analysis
Stability Requires a Complete Output Time Series
During an operating period, if current remains constant but target-product selectivity declines, cumulative target production will still suffer. Actual product output and energy consumption should be integrated over each time interval, with faults, cleaning, and electrode replacement recorded. Selecting only the most stable window overestimates long-term delivery capability. Different batches and restart cycles are equally important, because engineering reliability is not simply the longest time a single electrode endured.作者分析与复核建议 / Author analysis
Mechanistic Calculations and Working-State Evidence
Theoretical calculations can compare adsorption and reaction pathways, but real interfaces may be affected by potential, electrolyte, and reconstruction. Post-reaction characterization does not necessarily preserve the working state either. Stronger explanations require calculations and in situ or operando observations to provide joint constraints, while acknowledging that alternative pathways may remain possible. A lower calculated barrier does not automatically justify asserting that the corresponding step entirely controls the observed change in selectivity.作者分析与复核建议 / Author analysis
Levels of Replication and Best-Performer Bias
Material batches, electrode preparation, and reactor assembly can all affect performance. Multiple time points are not multiple independent electrodes, and multiple electrodes do not necessarily come from independent material batches. Studies should report distributions across these levels, failed samples, and complete conditions rather than only the best electrode. Controls should share the reactor and analytical procedures as far as possible, so that catalyst comparisons are not dominated by equipment differences.作者分析与复核建议 / Author analysis
Misaligned Objectives in AI Catalyst Screening
A model that optimizes only adsorption energy or target-product selectivity may overlook electrode lifetime, carbon utilization, and separation. A more appropriate design should produce multiobjective candidates and uncertainty estimates, then validate them against a complete system budget. When training data lack failures or operating-condition information, models readily inherit selection bias from the literature. This article recommends including reactor and measurement boundaries among model inputs, avoiding the conflation of numbers obtained under different conditions into a unified label.作者分析与复核建议 / Author analysis
Independent Verification of Analytical Examples
The product electrical energy equation can be derived by multiplying the electron count by the Faraday constant, then checked step by step through charge and mass conversions. The recycling equation can be verified by enumerating and summing successive cycles. Neither test involves actual catalytic measurements or constitutes a process simulation. The figure serves to reveal whether the other ledgers hold when one metric improves; readers can modify the inputs and examine when the conclusions reverse.作者分析与复核建议 / Author analysis
A Falsifiable System-Level Advantage
If a catalytic improvement is effective, it should reduce total electrical energy or carbon loss at the same product purity and system boundary while maintaining deliverable production rate and reliability. If it raises Faradaic efficiency but substantially increases cell voltage, the advantage may disappear; if it reduces carbonate formation but requires more complex separation, the calculation must also be redone. Specifying these failure conditions in advance helps prevent every local improvement from being presented as a system-wide breakthrough.作者分析与复核建议 / Author analysis
Carbon Balance Residuals Must Not Be Hidden
If inlet, product, and outlet carbon cannot be balanced, the missing fraction may reside in the solution, membrane, or solid phase, or may arise from analytical and flow-measurement errors. The residual should have its own interval, and its variation with current and time should be examined. Assigning the entire residual to the target product inflates utilization; treating it all as harmless unreacted gas may instead underestimate recovery costs. System comparisons can converge only after the source of the residual is located.作者分析与复核建议 / Author analysis
Report Target Production Rate and Selectivity Together
At the same Faradaic efficiency, a lower total current produces less target product; at the same target production rate, a higher full-cell voltage increases energy input. Areal production rate, stable operating duration, and product purity should therefore be reported together, with an explicit statement of whether area refers to geometric or active surface area. A multiobjective frontier explains design trade-offs better than a single-metric ranking and also prevents apparent efficiency improvements from being manufactured by reducing the load.作者分析与复核建议 / Author analysis
Research Package and Conclusions
Materials provided for verification should retain current, full-cell voltage, flow rates, all major products, carbon balances, analytical calibrations, operating conditions, batches, and faults. The most valuable advances in carbon dioxide electrolysis improve the charge, carbon, and energy ledgers simultaneously and allow independent teams to recalculate them within the same boundaries. Catalyst mechanisms and systems engineering thereby constrain one another, rather than each presenting its most favorable numbers.作者分析与复核建议 / Author analysis
Core Equations and Derivations
(1) Product electron stoichiometry and total charge; ni is the molar amount of product.
LaTeX
\mathrm{FE}_i=z_iF n_i/Q(2) When M is given in kg/mol, the result is in kWh/kg; auxiliary equipment and separation are excluded.
LaTeX
e_{\rm electric}=zFV_{\rm cell}/(\mathrm{FE}\,M\,3.6\times10^6)(3) Accounting on a carbon-atom basis differs from Faradaic efficiency.
LaTeX
U_C=n_{C,\rm target}/n_{C,\rm feed}(4) An ideal model with constant single-pass conversion, in which only the unreacted fraction is recovered at fraction r.
LaTeX
U_{\rm recycle}=u/[1-r(1-u)]Methods and Evidence Workflow
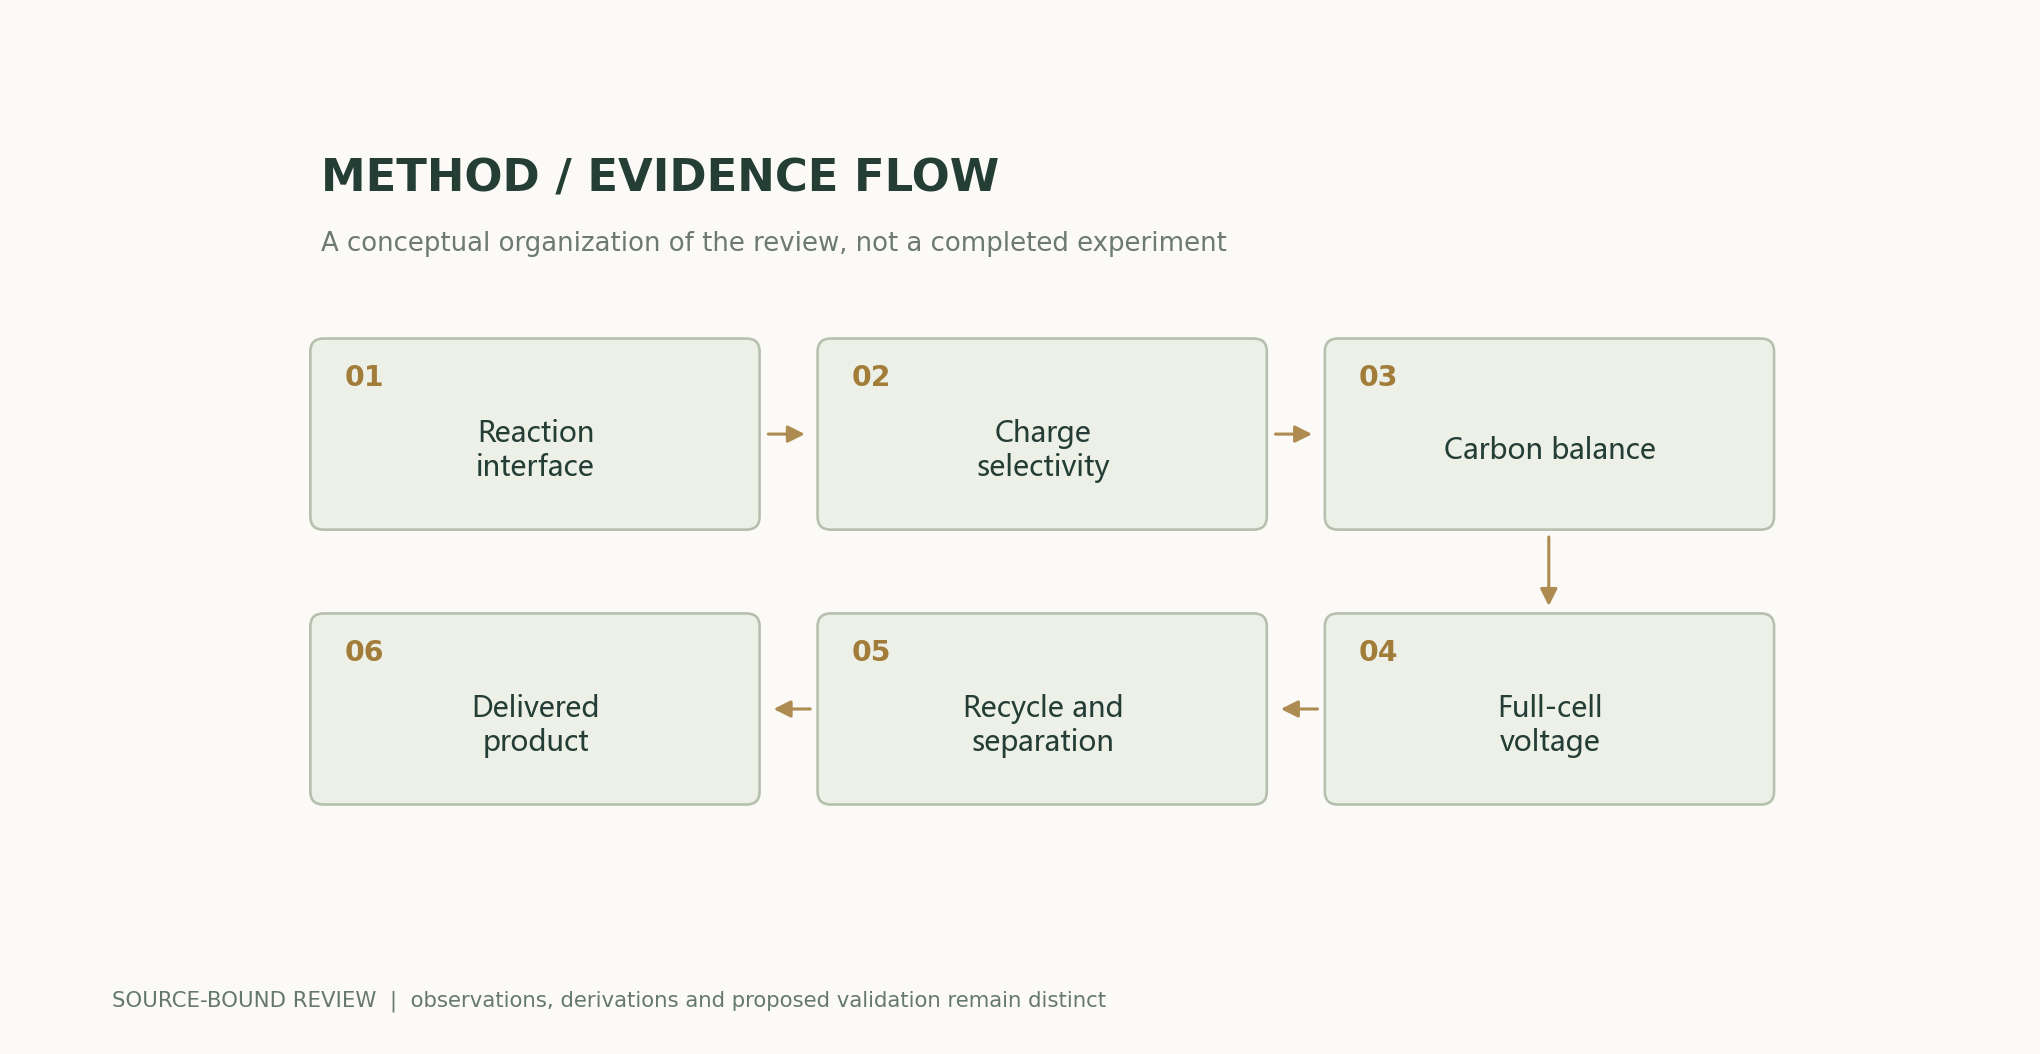
Analytical Figures and Numerical Examples
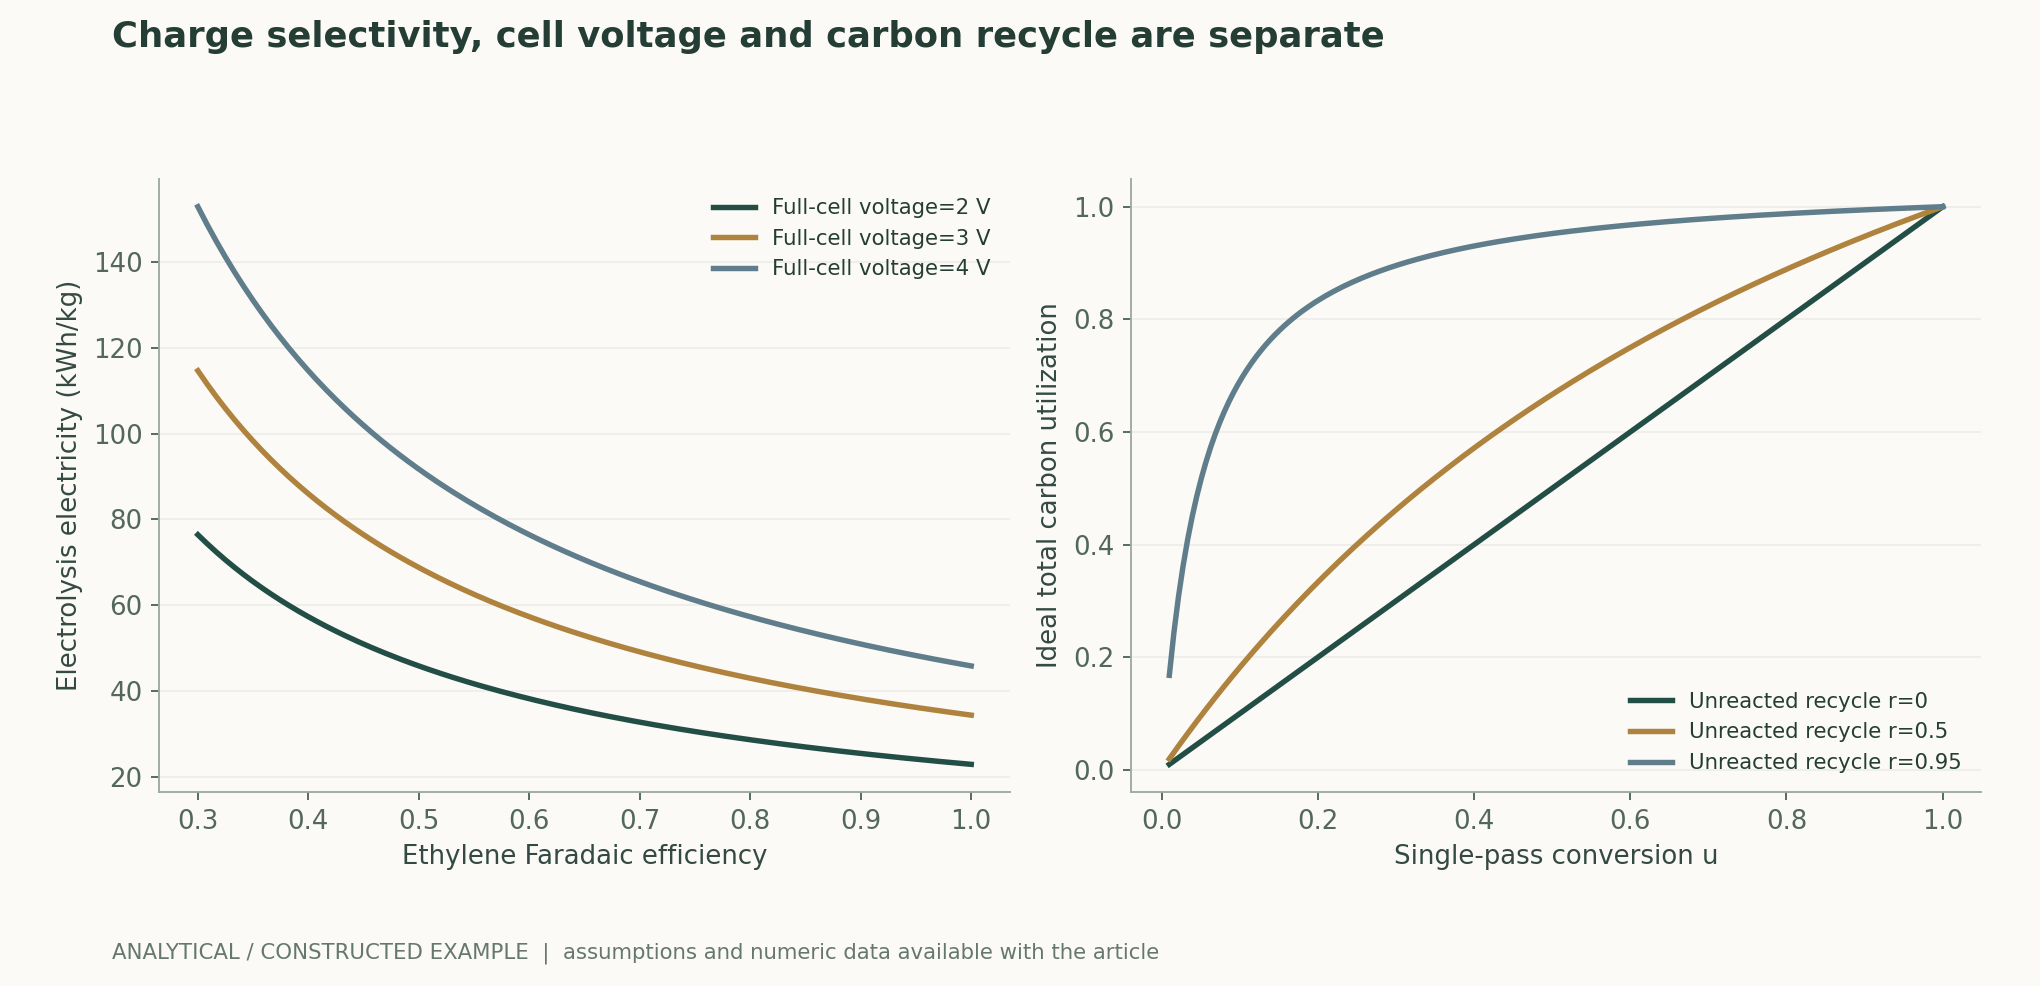
Recalculable Worked Example
At a full-cell voltage of 3 V and FE=0.8, the ethylene electrolysis component is approximately 42.990898 kWh/kg; with u=0.2 and r=0.95, ideal overall utilization is 0.833333. These are not whole-process energy consumption or performance from the original paper.
Comparison of Methods
| Method or accounting basis | Directly constrains | Evidence still needed |
|---|---|---|
| Faradaic efficiency | Charge selectivity | Carbon loss and full-cell voltage |
| Single-pass carbon utilization | Feed carbon entering the product | Recycling and separation |
| Cathode potential | Local reaction driving force | Full-cell and auxiliary energy consumption |
| Full-cell electrical energy | Electrolysis input | Purification and compression |
| Stable operation | Maintaining performance under specified operating conditions | Batches and interruption costs |
| Life-cycle results | Complete counterfactual effect | Carbon source, energy, and product fate |
Verification and Experimental Plan
- Fix the product, purity, and system boundary.
- Calibrate measurements for all major gas and liquid outlets.
- Save synchronized records of current, cell voltage, and production.
- Close charge and carbon balances separately.
- List recycling, carbonate, and crossover.
- Integrate energy consumption for separation and auxiliary equipment.
- Verify using independent electrodes and material batches.
- Disclose unit conversions, failures, and counterfactual assumptions.
Scope and Limitations
- No new electrolysis, catalytic, or plant experiments.
- Analytical electrical energy excludes auxiliary equipment and separation.
- The recycling equation does not apply to unrecoverable carbon losses.
- Local potential relative to a reference electrode is not full-cell voltage.
- Carbon utilization cannot automatically be equated with permanent removal or net emissions reduction.
Evidence from the Original Studies and Its Scope
| Original study findings | Scope | Source and location |
|---|---|---|
| Alkaline copper interface design affects ethylene selectivity and stability. | Original electrodes and reaction conditions. | CO2 electroreduction to ethylene via hydroxide-mediated copper catalysis at an abrupt interfaceAbstract; abrupt interface |
| The strong-acid route investigates carbonate losses and conversion to multicarbon products. | Original environment and performance boundaries. | CO2 electrolysis to multicarbon products in strong acidAbstract; carbon utilization |
Research Questions Worth Testing
- Does whole-system electrical energy still decrease after selectivity improves?
- When does the recovery burden offset the advantage of single-pass conversion?
- How does the working-state interface relate to the long-term output distribution?
Mapping Primary Sources to Claims
- CO2 electroreduction to ethylene via hydroxide-mediated copper catalysis at an abrupt interfaceCao-Thang Dinh, Thomas Burdyny, Md Golam Kibria, Ali Seifitokaldani, Christine M. Gabardo, F. Pelayo García de Arquer, et al. · 2018-05-18Abstract; reaction interface and stability
- CO2 electrolysis to multicarbon products in strong acidJianan Erick Huang, Fengwang Li, Adnan Ozden, Armin Sedighian Rasouli, F. Pelayo García de Arquer, Shijie Liu, et al. · 2021-06-04Abstract; carbon utilization analysis
Citation and Manuscript Export
BibTeXRISCSL JSONTXTArticle JSON
Author, Version, and Sources
A source-supported research review and original analysis written by Codex (AI). Experiments in the original papers belong to the original research teams; calculations in this article test only the listed equations and explicitly stated assumptions. This site currently has no record of independent peer review or original model, clinical, or physical experiments for this article.
First publication: an in-depth interdisciplinary feature on scientific evidence, preserving section-level sources and the boundary between evidence from the original studies and the author's analysis.
The conceptual cover was generated by ImageGen. Scientific figures were plotted using the accompanying code and numerical files; their captions specify assumptions and measurement bases individually.
Cover and Scientific Figure Sources · Data, Sources, and Assumptions · Python · Recalculable Code · Publication and Version History
Source revision: 500575872cce7c4b9c4062a12bb0692eb580c2da