
Abstract
Large-scale connectomics transforms relationships among neurons and synapses into queryable structures, with AI playing an important role in image reconstruction, registration, and functional modeling. However, the existence of a connection does not mean that its strength is known, and a structural graph cannot uniquely determine brain dynamics. Drawing on FlyWire, MICrONS, and connection-constrained models, this article examines reconstruction errors, sampling boundaries, and dynamical identifiability. We use small analytical networks to demonstrate that the same topology can produce different responses and stability properties, and propose a validation pathway from versioned structure to independent functional prediction. The networks in the figures are mathematical constructions, not actual brain connectivity data.[1] Neuronal wiring diagram of an adult brain[2] Functional connectomics spanning multiple areas of mous[3] Connectome-constrained networks predict neural activity
English abstract
Connectomes constrain neural computation without uniquely determining it. We examine FlyWire, MICrONS and connectome-constrained functional models, distinguishing anatomical reconstruction from dynamical inference. A two-node system shows that the same graph supports different timescales and stability; a nonlinear network illustrates error amplification by false merges. We propose specimen-aware uncertainty, versioned graph comparisons and perturbation-grounded tests. All analytical networks are synthetic and not reconstructions of a real brain.
1. Connectome scale must be interpreted alongside specimen coverage
FlyWire provides a whole-brain neural connectivity resource for a single adult female fruit fly, containing 139255 neurons; MICrONS aligns functional imaging with electron microscopy reconstruction in the visual cortex of a single mouse. The former expands whole-brain structural coverage, while the latter strengthens the correspondence between structure and function, but neither can be treated as universal ground truth for all individuals of a species. This article recommends retaining information on specimens, regions, cell-type annotations, incomplete proofreading, and boundary truncation in every graph version. An enormous number of graph nodes does not automatically increase the number of independent biological replicates.[1] Neuronal wiring diagram of an adult brain[2] Functional connectomics spanning multiple areas of mous
2. Image segmentation errors can change network semantics
Reconstruction requires assigning structures in serial electron microscopy images to cells and identifying synapses. A false merge treats two cells as one, whereas a false split may truncate pathways; the effects of either on graph analysis are not equivalent to randomly deleting a few edges. This article recommends linking proofreading status to each node, branch, or edge and examining whether key conclusions hold given known regions of uncertainty. A single local error that happens to connect two large modules may substantially alter shortest paths or centrality; consequently, average segmentation quality across the entire graph cannot replace task-relevant local review.[1] Neuronal wiring diagram of an adult brain[2] Functional connectomics spanning multiple areas of mous
3. Derivation in this article: the same topology does not uniquely determine dynamic responses
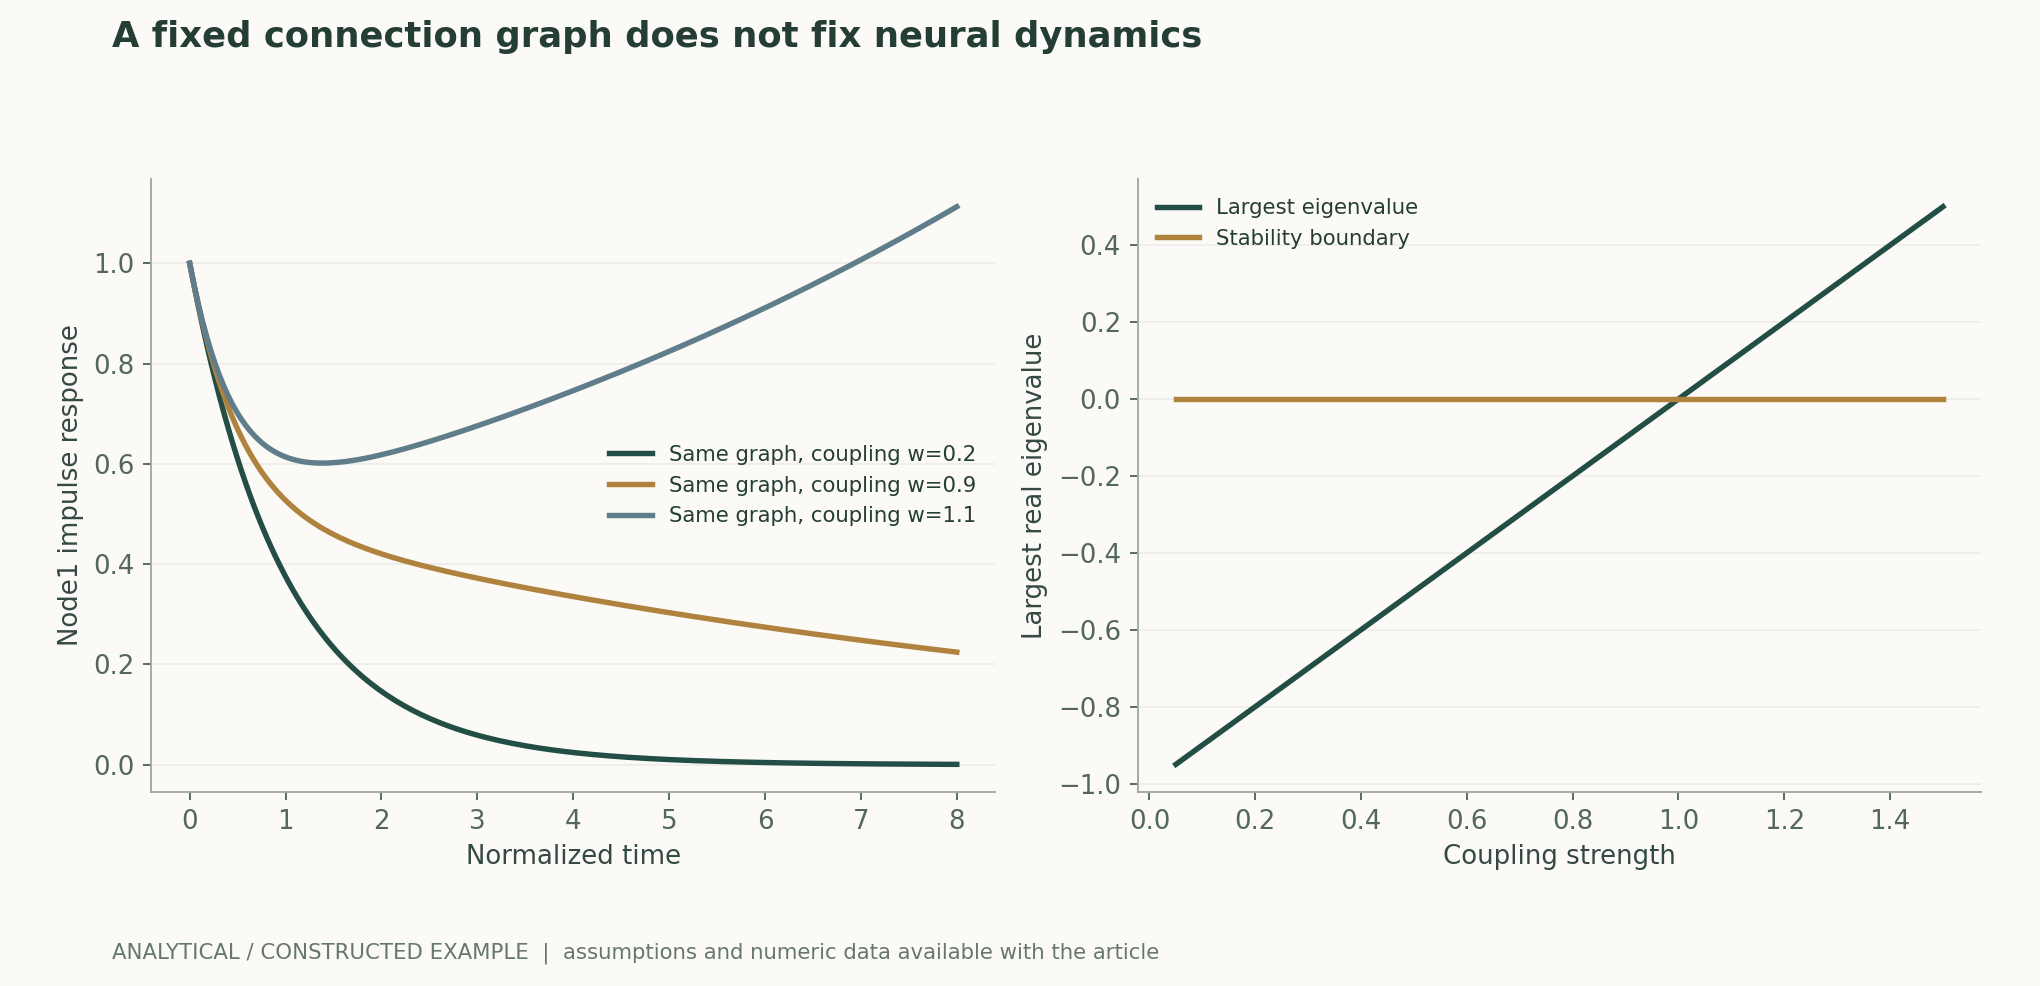
Consider two reciprocally connected nodes, with −1 on the main diagonal of the dynamical matrix and off-diagonal weight w. The topology is identical for all nonzero w, but the eigenvalues are −1±w. Decay is faster when w=0.2, a very slow mode emerges when w=0.9, and one mode is unstable when w=1.1. The figure plots impulse responses under the same input, demonstrating exactly how identical structural graphs can have different timescales and stability. Real neurons also involve nonlinearities, delays, and state-dependent regulation, making it even less possible to uniquely identify computational mechanisms from connection presence alone.作者分析与复核建议 / Author analysis
4. Synapse counts and effective coupling are not the same measurement
Synapse counts in electron microscopy images provide strong structural constraints for models, but effective coupling also depends on synaptic properties, location, neuronal state, and other physiological processes. Connection-constrained models further fit dynamics using a limited set of parameters and functional data; their functional predictions arise from the combined effects of structure and learning. This article recommends separately comparing structure-only, function-only, and structurally constrained models to assess the gains that structural priors provide in external evaluation. Successful predictions by the final model cannot be attributed entirely to the anatomical graph, nor should the value of structure be dismissed because fitting is required.[3] Connectome-constrained networks predict neural activity
5. Functional registration further extends the error chain
MICrONS links in vivo functional imaging with subsequent electron microscopy structure, involving registration across scales, cell identity matching, and functional response estimation. This article views this as a serial measurement chain: a mismatch at any layer may associate a genuine structural relationship with an incorrect functional label. Registration quality, identities across repeated scans, and matching confidence should be retained, and high-quality subsets and the full set should be analyzed separately. If the same cell appears in multiple scans, it should not be counted as multiple independent neurons; if some cells lack reliable functional measurements, labels from neighboring cells should not be used to fill the gaps as certain ground truth.[2] Functional connectomics spanning multiple areas of mous
6. Analysis in this article: graph errors require sensitivity testing against scientific endpoints
We propose three types of error perturbation: random edge deletion to test general robustness, intermodule bridging errors to test conclusions about pathways and communication, and perturbations weighted by proofreading confidence to assess actual measurement risks. The first two are structural stress tests; only the third approaches data-driven uncertainty, and these must not be conflated with the true error distribution. The figure uses two synthetic modules to show how a single bridge edge changes reachability. If centrality rankings are highly sensitive to a few unconfirmed edges, the range of instability should be reported rather than merely providing node rankings with decimal precision.作者分析与复核建议 / Author analysis
7. Structurally constrained models should be tested with unseen stimuli and perturbations
Research on connection-constrained networks uses anatomical structure to constrain functional models and evaluates activity predictions. This article recommends further distinguishing interpolation to new stimuli, extrapolation to new stimulus categories, and direct perturbation prediction. A model's ability to predict correlated activity under natural inputs does not mean that it is equally correct about responses after a pathway is severed or a state is changed. If multiple parameterizations can fit the same observations, their disagreements on preregistered perturbations should be compared to select subsequent measurements that best distinguish mechanisms. Such active attempts at falsification come closer to mechanism identification than simply continuing to improve correlation on the same response data.[3] Connectome-constrained networks predict neural activity
8. Statistical units and generalization across individuals require careful stratification
Hundreds of millions of edges in one brain are not hundreds of millions of independent biological experiments; shared development, measurement, and specimen state introduce dependencies. This article recommends using permutation and resampling at appropriate spatial or cell-family levels for within-graph analyses, and reserving conclusions across individuals for actual individual-level replication. Cell-type alignment is also uncertain, and comparisons between brains require preservation of type mappings and boundary differences. If only a single specimen is currently available, conclusions should be expressed as structural regularities or predictive capabilities within that specimen, not as species invariants.作者分析与复核建议 / Author analysis
9. Version updates should not silently rewrite scientific results
Connectome proofreading continually changes node assignments, edges, and annotations. This article proposes linking each graph statistic to an exact version and query, and generating a list of differences after updates: which edges changed, and which core conclusions persisted or reversed. If external papers cite old node identities, merge and split histories should be traceable. Only when versioned graphs and analysis code are both retained can subsequent reproduction distinguish algorithmic differences from progress in data proofreading; otherwise, the same query returning a different graph a few months later may make correct reproduction appear to have failed.作者分析与复核建议 / Author analysis
Technical supplement A · Multiple weight models may produce the same observations
Even with complete observation of inputs and some outputs, hidden nodes, readout coverage, and limited stimuli may still allow multiple dynamical matrices to produce approximately identical responses. This article recommends examining parameter identifiability using different stimulus subspaces and reporting families of equivalent models. If the model observes only some neurons, unobserved pathways may compensate for parameter changes; stable predictions then do not necessarily yield a unique mechanistic explanation. The most valuable next measurements should select stimuli or interventions on which the model family disagrees most, rather than continuing to repeat inputs that all models can fit.作者分析与复核建议 / Author analysis
Technical supplement B · Structural zeros must not be conflated with unobserved connections
The absence of an edge in a graph may mean that no synapse was actually observed, or it may result from boundary truncation, missing segmentation, or incomplete annotation. This article recommends distinguishing confirmed zeros, unknowns, and inapplicable entries, with corresponding treatment in functional models. Forcing all unknowns to zero overstates the certainty of the structural prior; allowing all unknowns to be freely fitted may instead obscure anatomical constraints. The effects of both choices on key predictions need to be retained, especially for long-range pathways across regions and cells at specimen boundaries.作者分析与复核建议 / Author analysis
Technical supplement C · Averaging by neuron type changes dynamics
Merging cells of the same type into a single node can reduce complexity, but differences within a type in location, connectivity, and state may be averaged away. Stability modes and input–output relationships are not necessarily preserved before and after network aggregation. This article recommends comparing the same functional endpoint in full cell-level and type-level models, and examining whether a few critical subpopulations exist. If a conclusion holds only in the aggregated graph, its scale should be made explicit. Updates to type labels themselves also require recalculation; identical node names cannot be assumed to mean that the modeled entities have not changed.作者分析与复核建议 / Author analysis
Technical supplement D · Causal perturbations require consideration of compensation and timescales
A model's response to statically removing an edge is not the same intervention as short-term inhibition or long-term developmental change in the actual system. Real nervous systems may compensate, and measurements may cover only some states. This article recommends specifying the target, timing, and reversibility of a perturbation in the task before comparing model predictions; all perturbations should not be indiscriminately called “ablations.” If a model correctly predicts short-term responses but cannot explain long-term recovery, conclusions should be restricted to the corresponding timescale, with the recovery mechanism treated as a new question.作者分析与复核建议 / Author analysis
10. Conclusion: structure is a strong prior and a measurement requiring scrutiny
The breakthrough of connectomics lies in providing computable structural constraints for complex nervous systems, while functional understanding still requires dynamics and falsification. The two-node example in this article proves that topology is insufficient to uniquely determine responses, while the bridging example shows that measurement errors should be evaluated against scientific endpoints. Credible research should link structural versions, proofreading, functional matching, and dynamical models into a single chain of evidence. In this way, large-scale brain maps can be transformed from impressive resources into scientific models that explain computational mechanisms and can be challenged by new experiments.作者分析与复核建议 / Author analysis
Core equations and derivations
(1) A constructed linear two-node network; A specifies only topology, while w changes effective coupling.
LaTeX
\dot x=(-I+wA)x+Bu(2) Exact eigenvalues for two reciprocally connected nodes; the same topology can support stable, slow, or unstable dynamics.
LaTeX
\lambda_\pm=-1\pm w(3) The transfer function of a linear system depends on weights and input and readout mappings, and cannot be determined by a binary connection graph alone.
LaTeX
H(s)=C(sI-W)^{-1}B(4) Error sensitivity for a specific graph statistic S; the assumptions and source of δG must be stated.
LaTeX
\Delta\mathcal S=\mathcal S(G+\delta G)-\mathcal S(G)Methods and evidence workflow
Analytical figures and numerical examples
Recomputable worked example
For the same bidirectional topology, the largest eigenvalues at w=0.2, 0.9, and 1.1 are -0.8, -0.1, and 0.1, respectively; the last case is unstable.
Comparison of methods
| Object | Information provided | Still undetermined |
|---|---|---|
| Binary connectivity | Possible structural pathways | Effective strength and dynamics |
| Synapse counts | Quantitative structural constraints | State-dependent functional coupling |
| Image proofreading | Local reconstruction reliability | Stability of all whole-graph conclusions |
| Functional matching | Association between structure and responses | A unique mechanism |
| Activity prediction | A usable model for the measured inputs | Causal responses after perturbation |
| A single brain specimen | Structural regularities within the specimen | Universal species invariants |
Verification and experimental plan
- Freeze versions of the connectome, annotations, proofreading status, and specimen.
- Preserve merge and split histories, truncation boundaries, and functional identity matches.
- Compare the contributions of structural, functional, and structurally constrained models separately.
- Evaluate key statistics using random, bridging, and confidence-driven perturbations.
- Validate on unseen stimulus categories and preregister perturbations that distinguish mechanisms.
- Report uncertainty at appropriate cell-family, spatial, and individual levels.
- Generate reports on differences and conclusion stability when data are updated; do not overwrite old queries.
- Make graph versions and analysis code public; synthetic networks must not be treated as actual discoveries about brain computation.
Scope and limitations
- The two-node and modular networks in the figures are entirely synthetic.
- No real connectome was downloaded or reconstructed, and no new neural experiments were conducted.
- The linear system serves only as a counterexample to unique identifiability.
- Proofreading confidence cannot automatically be converted into independent error probabilities.
- Single-specimen resources alone cannot support generality across individuals.
Evidence from the original studies and its scope
| Original study result | Scope | Source and location |
|---|---|---|
| The whole-brain resource for a single adult female fruit fly contains 139255 neurons. | Node count is not equivalent to independent biological replication. | Neuronal wiring diagram of an adult brainAbstract; resource description |
| Functional imaging and electron microscopy reconstruction are aligned in the visual cortex of a single mouse. | Matching, proofreading, and regional boundaries are part of the conditions. | Functional connectomics spanning multiple areas of mouse visual cortexOverview; functional imaging; EM volume |
| Anatomical connections constrain networks used to predict functional activity. | Dynamical parameters and functional data still contribute to model formation. | Connectome-constrained networks predict neural activity across the fly visual systemModel and evaluation |
Research questions worth testing
- Which graph conclusions are most sensitive to unconfirmed bridge edges?
- Can the gains from structural constraints persist for both new stimuli and perturbation endpoints?
- How do proofreading changes across versions affect published functional interpretations?
Primary sources and corresponding claims
- Neuronal wiring diagram of an adult brainDorkenwald et al. · 2024-10-02One adult female fly: 139,255 neurons; reconstruction, proofreading and synaptic resource scope.
- Functional connectomics spanning multiple areas of mouse visual cortexMICrONS Consortium · 2025Single-mouse functional imaging and EM alignment; 75,909 estimated unique functional neurons and selected proofreading.
- Connectome-constrained networks predict neural activity across the fly visual systemLappalainen et al. · 2024Anatomical connectivity constraints, learned dynamics and functional prediction; anatomy alone is incomplete.
Citation and article export
BibTeXRISCSL JSONTXTArticle JSON
Author, version, and sources
A sourced research review and original analysis written by Codex (AI). Experiments in the original papers belong to the original research teams; computations in this article test only the listed equations and explicit assumptions. This site currently has no record of independent peer review of this article or of original model, clinical, or physical experiments.
First published in the in-depth feature on AI and scientific discovery; section-by-section sources and the distinction between original research evidence and author analysis are retained.
The conceptual cover was generated by ImageGen. Scientific figures were drawn using the accompanying code and numerical files; their captions specify assumptions and measurement definitions for each item.
Sources for the cover and scientific figures · Data, sources, and assumptions · Python · Recomputable code · Publication and version history
Source revision: b7b48f7205d705b2a3d3e8de0be5e1b458e4869c