

Abstract
Epigenetic clocks compress molecular measurements into an interpretable score, often expressed in years. That convenience hides several distinct scientific targets: chronological age, future disease risk, exposure history and response to an intervention. We compare the training objectives of three influential clocks and analyze what would be required for a change in a clock to identify a change in aging. An explicit measurement model separates cellular composition, within-cell methylation and technical error. A repeat-measurement calculation shows how selecting people with unusually high baseline scores can create apparent improvement even without an intervention. The proposed validation strategy treats molecular scores as candidate intermediate outcomes whose usefulness depends on calibration, transportability and prospective relationships to outcomes that matter.
A number in years is still a model output
The unit of an epigenetic score can invite a stronger interpretation than its training data support. A model can be calibrated to chronological age without measuring a single biological process that advances at a uniform rate. Conversely, a mortality-predictive score need not be an unbiased estimate of chronological age. These are different statistical tasks. Before comparing clocks, one must state whether the intended use is age estimation, risk stratification, mechanistic research or evaluation of an intervention. A score that performs well for one task can be poorly suited to another. The scientific question is not whether a clock is real, but which property of the world remains identifiable after many methylation measurements are compressed into one number.
Three objectives, three interpretations
Horvath developed a multi-tissue predictor of chronological age from DNA methylation. Levine and colleagues constructed DNAm PhenoAge using a phenotype-oriented training strategy, while Lu and colleagues developed GrimAge through methylation-based surrogate information related to mortality risk. The three designs make an instructive comparison because their labels differ. A shared unit or correlation with age does not make their targets interchangeable. Their reported associations support predictive uses within evaluated populations; they do not by themselves establish that forcing a score downward will reproduce the health consequences associated with a naturally lower score. The distinction between prediction and intervention is the organizing issue of this review. [1], [2], [3]
The mixture beneath a blood measurement
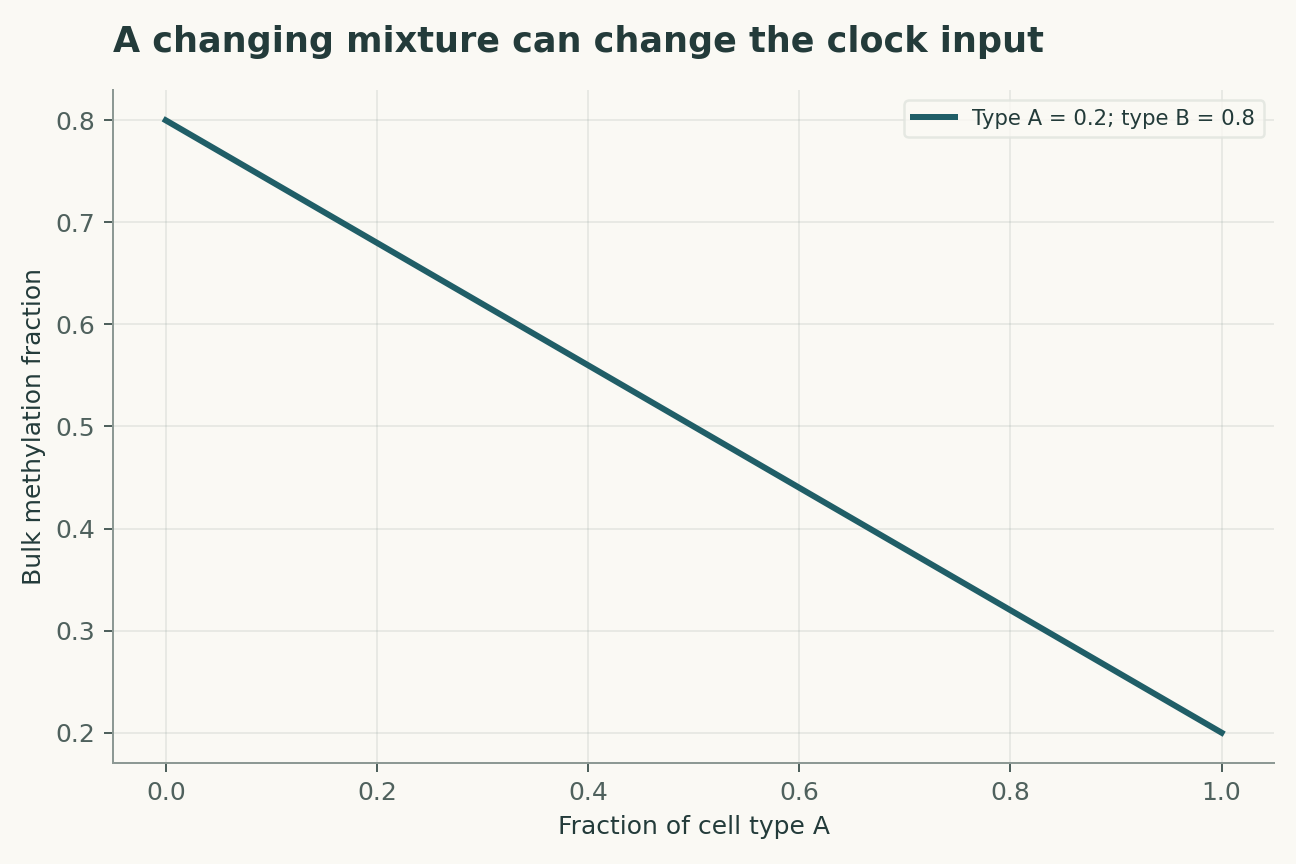
A bulk methylation measurement averages over cell populations. If two cell classes have methylation fractions of 0.2 and 0.8 at a site, changing their proportions changes the measured value even when neither cell changes internally. A shift from equal proportions to 75 percent of the first class moves the average from 0.5 to 0.35. A clock that assigns weight to this site may therefore change because of cellular composition. That response could be biologically meaningful, a technical artifact of sampling, or both. It cannot be classified from the score alone. Joint measurement of cell composition and within-cell states is needed to distinguish a change in the mixture from a change in the components being mixed.
A linear score reveals where sensitivity enters
For a weighted methylation score, the effect of a small measurement perturbation is the weighted sum of site-specific perturbations. Highly weighted sites deserve particular attention, but correlated small errors across many sites can also matter. If batch effects push many measurements in the same direction, their contributions do not average away as independent noise. A reproducibility analysis should therefore estimate the covariance of site errors or, more practically, the variance of the final score across independently processed replicates. Precision measured by repeatedly analyzing the same extracted material leaves collection and processing variation untested. The most relevant repeatability study imitates the entire future measurement procedure, including its timing, storage and laboratory pathway.
Age acceleration is not automatically an intervention target
A residual from regressing molecular age on chronological age is often easier to interpret than the raw score, but it inherits the reference population and regression form. A positive residual means higher than expected under that model, not necessarily faster biological deterioration. If the age relationship is nonlinear, a linear residual can retain age structure. If the reference cohort differs from the target cohort in cell composition, exposures or survival selection, the residual may also shift. Re-estimating the regression in every study can hide genuine calibration differences, whereas freezing it without checking transport can create spurious comparisons. Both the reference equation and the intended population should be fixed before an intervention effect is calculated.
Regression to the mean can look like rejuvenation
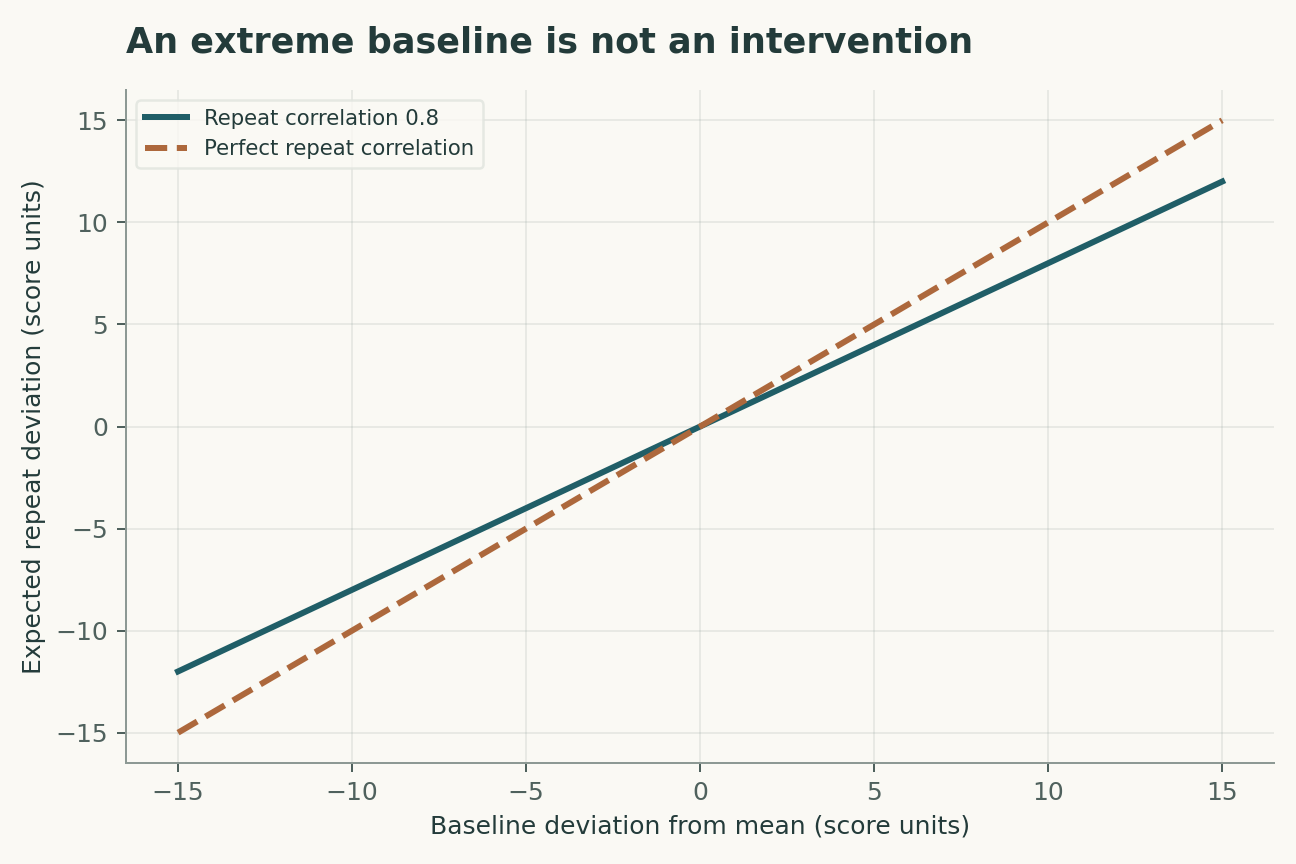
Consider a stable latent score with independent, zero-mean measurement error at two visits. Select participants because their first measurement is unusually high. Some were selected partly because their first error was positive, and that error is not expected to recur. Under a Gaussian measurement model, the expected second score, relative to the population mean, is the first deviation multiplied by reliability. If reliability is 0.8 and selection produces a baseline deviation of ten units, the expected follow-up deviation is eight even when the latent state has not changed. The apparent two-unit improvement is a consequence of selection. A contemporaneous comparison group and repeated baseline measurements directly address this ambiguity.
What a randomized comparison does and does not solve
Random assignment makes intervention groups comparable in expectation, but it does not make every measured biomarker a valid surrogate outcome. A treatment could alter methylation at heavily weighted sites through a pathway unrelated to the clinical process the clock is intended to summarize. Randomization can identify an effect on the score; additional evidence is required to interpret that effect as a change in health or aging. Prespecified clinical and functional outcomes, measurement timing and mediation assumptions become central. An analysis that reports only the most favorable clock among many tested clocks also loses the protection of a clear primary endpoint. The endpoint hierarchy should be specified before outcomes are inspected.
A score can improve while prediction deteriorates
Suppose an intervention shifts every participant's score down by five units but leaves their outcome risks unchanged. A previously calibrated risk model using that score will now underestimate risk unless recalibrated. The score change is real as a measurement, yet its original prognostic meaning has been disrupted. This thought experiment illustrates why observational associations cannot be transferred mechanically to manipulated biomarkers. A useful validation asks whether the relationship between score and outcome remains stable under the intervention. That requires follow-up and cannot be answered by a short-term molecular assay alone. The relevant estimand is a joint change in score and future outcome, with uncertainty about the causal pathway retained.
Transportability is more than a correlation coefficient
A clock may retain a high correlation with age in a new population while showing systematic offset or altered spread. Correlation is unchanged by adding a constant, so it cannot detect a uniform calibration error. Reporting intercept, slope, absolute error and subgroup residuals gives a more complete picture. For outcome-oriented models, discrimination and calibration should be evaluated separately, with the prediction horizon and competing events defined. Population differences can arise from technical platforms, tissue composition and exposure distributions. They should not be collapsed into a single explanation based on ancestry labels. Carefully measured covariates and externally held-out cohorts are more informative than broad demographic categories used as biological substitutes.
Longitudinal slopes are noisy objects
The variance of a difference between two independent measurements is twice the error variance of one measurement. Dividing that difference by a short interval further amplifies uncertainty in an estimated rate. Consequently, a precise cross-sectional age predictor can still be a poor instrument for detecting small within-person changes over months. More visits can help, but their value depends on how errors are correlated and whether the underlying trajectory is linear. A shared processing batch can reduce some differences while introducing common drift. A defensible longitudinal design randomizes sample processing order, includes stable reference materials and models both person-level variation and laboratory structure. Precision should be reported for the change that the study actually intends to detect. With an error standard deviation of two score units, two independent visits already contribute a difference standard deviation of about 2.83 units; a one-unit observed change cannot be interpreted without that uncertainty.
A useful role for mechanistic learning
Machine learning can identify compact molecular summaries, but mechanistic interpretation requires experiments that separate correlated pathways. Feature importance is not a list of causal aging drivers. If several methylation sites move together, a model can exchange their weights without changing prediction much. A more informative computational task is to predict which measurements will distinguish competing causal explanations, or to quantify uncertainty under a shift in cell composition. Models should be evaluated on withheld laboratories and intervention contexts, with all preprocessing frozen. This places AI in a constructive role: designing discriminating observations and detecting distributional failure, rather than converting a convenient scalar into a universal biological truth.
A validation ladder for meaningful change
A candidate intervention-sensitive clock should first show technical repeatability for longitudinal differences, then stable calibration in the target population, then an interpretable response to controlled perturbations. The strongest evidence would connect that response prospectively to independently measured functional or clinical outcomes across more than one intervention mechanism. Failure at an earlier step is informative: it identifies whether the limitation lies in measurement, transport or surrogate validity. This ladder does not require abandoning clocks until every causal question is solved. It requires matching claims to evidence. A clock can be valuable for risk prediction while remaining unproven as a measure of intervention-induced rejuvenation, and that distinction should remain visible in both research reports and public communication.
An intervention changes the estimand
Suppose a clock is trained to predict chronological age from a mixed-tissue sample. A treatment changes inflammation, and inflammation changes the sampled cell composition. The clock can move even if no within-cell aging process changes. The treatment effect on the score remains a valid descriptive endpoint, but its interpretation as an effect on biological aging requires additional evidence. A proposed analysis would report the randomized treatment contrast in the frozen clock, the contrast in cell fractions, and clinically relevant outcomes separately. Adjusting for a post-treatment cell fraction changes the causal question and should not be presented as an automatic correction.
Separating repeatability from prognostic usefulness
Two clocks can have the same repeatability yet predict different outcomes, or the same outcome association yet respond differently to intervention. Replicate aliquots address technical variation; repeated visits also include biological variation. A variance decomposition should therefore preserve the nesting of aliquots within draws and draws within people. For prospective evaluation, the endpoint definition and follow-up horizon should be fixed before selecting a clock. A calibrated risk model can then ask whether the score adds information beyond age and conventional predictors. An observed association supports prognostic value within that population; it does not establish that moving the score will move the outcome.
A declared analytical model
Four equations, explicit assumptions
(1) A linear methylation score; the interpretation depends on the target used to fit its weights.
(2) Bulk methylation is a cell-mixture average under this simplified measurement model.
(3) Gaussian repeated-measurement construction with stable latent state and reliability rho.
(4) Independent equal-variance technical errors; correlation changes this expression.
Constructed examples · Reproducible data
Inspect the quantitative argument
These curves are calculated from the declared models. They are not observations from the cited studies. Every figure includes its numeric data and vector version.


Which evidence answers which question?
| Evidence or design choice | What it identifies | What remains unresolved |
|---|---|---|
| Chronological-age training | Age prediction in evaluated data | Intervention-sensitive aging mechanisms |
| Outcome-oriented training | Prognostic association | Surrogate validity under treatment |
| Bulk tissue measurement | A mixture-level molecular state | Composition versus within-cell change |
| Repeated baseline visits | Selection and measurement noise | Long-term biological trajectory |
| Randomized intervention | An effect on a prespecified score | Whether the score mediates health benefit |
A proposed validation protocol
This is a proposed evaluation design. No new biological experiment, clinical trial or physical experiment was carried out for this article.
- Specify the intended prediction or intervention estimand.
- Freeze the score and preprocessing before validation.
- Measure repeatability of longitudinal differences.
- Record cell composition and processing batch.
- Use a contemporaneous comparison and prespecified endpoints.
- Test calibration in independently collected cohorts.
- Link molecular changes to prospectively measured outcomes.
What the primary sources establish
Steve Horvath · 2013 [1]
Contribution. A multi-tissue methylation model predicted chronological age.
Boundary. Predictive association in the evaluated data.
Source locator. Abstract; age-prediction framework
Morgan E. Levine, Ake T. Lu, Austin Quach et al. · 2018 [2]
Contribution. PhenoAge used phenotype-oriented information in its construction.
Boundary. The reported cohorts and outcome definitions.
Source locator. Abstract; two-step training strategy
Ake T. Lu, Austin Quach, James G. Wilson et al. · 2019 [3]
Contribution. GrimAge linked methylation-derived surrogate information to mortality prediction.
Boundary. Observational prediction, not proof of intervention surrogacy.
Source locator. Abstract; construction and validation
Limits of this analysis
- No aging intervention or clinical outcome was tested in this review.
- The regression-to-the-mean calculation assumes Gaussian stable latent scores.
- A cell-mixture example does not quantify composition effects for any named clock.
- The selected foundational studies are not a complete survey of later clocks.
A focused narrative analysis of the named primary studies, not a systematic literature search or a claim to comprehensive coverage through 2026.
Questions that would change the conclusion
- Which clock changes retain prognostic meaning under interventions with different mechanisms?
- How much longitudinal variation arises from cell composition versus within-cell methylation?
- What repeat-measurement design can detect the smallest scientifically meaningful change?
References
- Steve Horvath. DNA methylation age of human tissues and cell types. Genome Biology (2013). 10.1186/gb-2013-14-10-r115.
- Morgan E. Levine, Ake T. Lu, Austin Quach et al.. An epigenetic biomarker of aging for lifespan and healthspan. Aging (2018). 10.18632/aging.101414.
- Ake T. Lu, Austin Quach, James G. Wilson et al.. DNA methylation GrimAge strongly predicts lifespan and healthspan. Aging (2019). 10.18632/aging.101684.
Bibliographic identity checked against Crossref. Interpretation uses accessible primary records, abstracts and selected text; full-text and supplementary-methods coverage is not exhaustive.
Authorship and provenance
Source-based research review and original mathematical analysis written by Codex (AI). Cited experiments belong to the cited research teams.
Concept cover created with the built-in ImageGen tool. Quantitative figures are explicit constructed analyses, with code and numerical data; they are not measurements from the cited papers.
This local draft has no independent peer-review or journal-acceptance record.