
Abstract: for which question must a model be reliable?
Organoids can reproduce certain developmental states and cellular interactions, but “resembling a particular tissue” does not constitute unconditional, overall equivalence. This article connects forebrain spheroid assembly with a human neural-organoid atlas and analyzes how donors, batches, cell composition, and culture duration alter interpretation. We emphasize that a model's value should be tied to explicit processes and endpoints, and use nested variance and a compositional counterexample to show that more single-cell measurements cannot replace independent biological replicates, and that atlas integration does not automatically eliminate genuine differences.[1] Assembly of functionally integrated human forebrain sph[2] An integrated transcriptomic cell atlas of human neural
English abstract
Organoids make selected developmental processes experimentally accessible while introducing donor, batch and composition variability. We connect forebrain spheroid assembly with a large neural-organoid atlas, derive nested variance and mixture examples, and distinguish molecular similarity from developmental equivalence and validated function. No organoids or biological experiments were produced.
The processes constrained by assembly studies
Birey and colleagues studied cell migration and functional integration by assembling spheroids associated with different forebrain regions, demonstrating the possibility of incorporating regional interactions into a model. This supports research on specific processes; it does not amount to producing a complete human brain or demonstrating consciousness. This article retains the boundaries set by the cells studied, developmental window, and measurement conditions, and does not generalize local circuit phenomena to all human neural functions.[1] Assembly of functionally integrated human forebrain sph
The role and boundaries of large atlases
He and colleagues integrated multiple single-cell datasets and differentiation protocols to construct a neural-organoid atlas, providing a coordinate system for comparing cell states and protocol differences. An atlas can organize heterogeneous material, but variation introduced by different donors, laboratories, and protocols should not all be treated as technical noise. This article focuses on the atlas's value as a reference while distinguishing “being mapped to similar states” from “having demonstrated developmental or functional equivalence.”[2] An integrated transcriptomic cell atlas of human neural
Cell counts and independent replicates
Cells within the same organoid share a donor, treatment, and environment, and are not fully independent biological trials. Sequencing more cells can improve the resolution of composition and states, but cannot replace additional independent donors or batches. If treatment is applied in only one batch, even hundreds of thousands of cells cannot independently distinguish treatment from batch. Statistical analyses should specify the primary unit of inference and avoid using cell counts to produce apparently extremely precise but unreliable statistical significance.作者分析与复核建议 / Author analysis
An analytical framework for nested variance
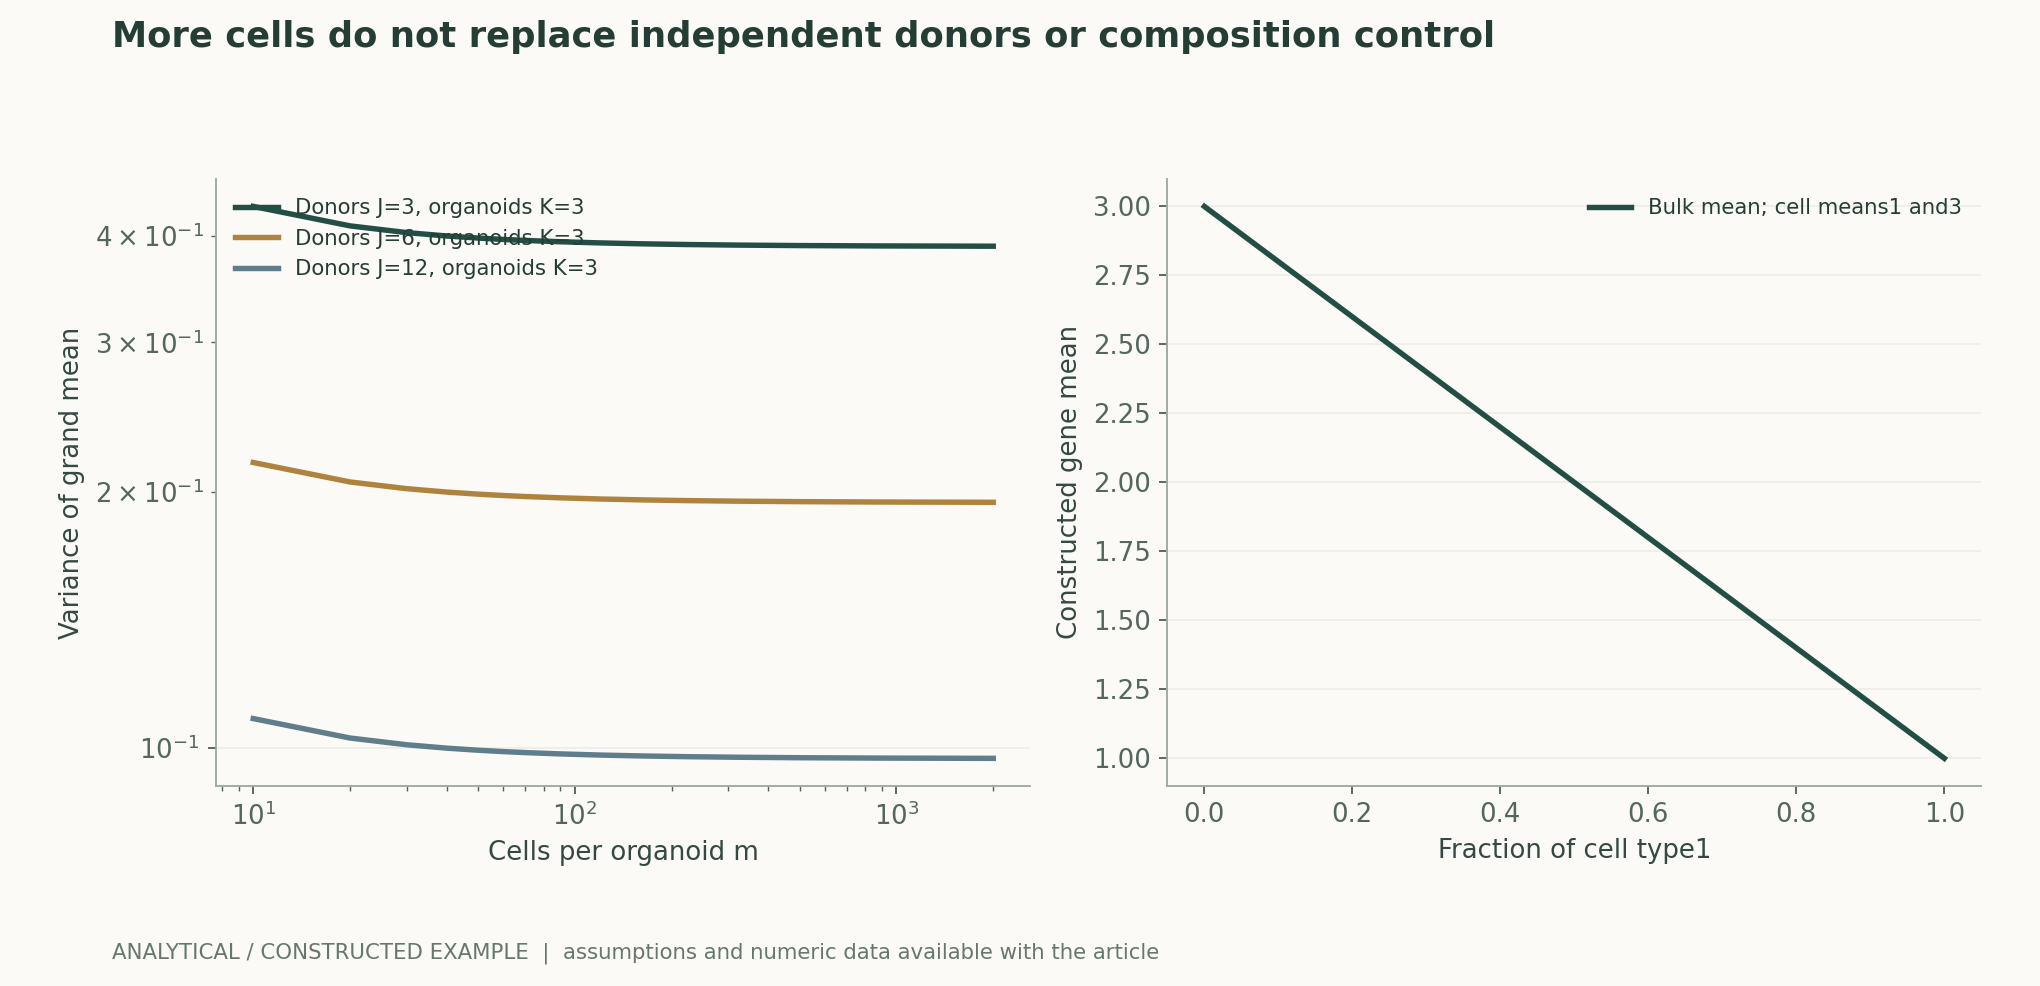
This article decomposes observations into donor-, organoid-, and cell-level variation, with each level's contribution to the variance of the mean reduced separately. Increasing the number of cells per organoid mainly reduces cell-level noise; donor-level differences still require more independent donors. All parameters in the figure are constructed and do not correspond to a real atlas. The figure illustrates that experimental budgets should be allocated around the principal sources of error, rather than assuming that measuring more cells is optimal for every question.作者分析与复核建议 / Author analysis
Composition changes can masquerade as state changes
Consider two constructed cell types with fixed mean expression of a gene at 1 and 3. When the proportion of the first type changes from 30% to 70%, the overall mean falls from 2.4 to 1.6, although nothing changes within either cell type. This example reminds us that overall expression differences may arise from composition. Studies should examine cell-type proportions and within-type states separately, rather than directly interpreting a decline in the overall mean as inhibition of an intracellular pathway.作者分析与复核建议 / Author analysis
Cell-type classification itself is uncertain
Cell states are often continuous, and labels depend on the reference, algorithm, and threshold. If treatment changes marker expression, a classifier may move the same kind of cell into another category, creating an apparent compositional change. Probabilities or uncertain labels should be retained, and conclusions compared across references and resolutions. Matching labels are not sufficient evidence of biological identity, and different labels do not necessarily indicate the emergence of an entirely new type.作者分析与复核建议 / Author analysis
Aligning developmental time
Days in culture are not the only developmental coordinate: donors and protocols may produce different maturation rates. Comparing samples at the same culture duration may introduce stage differences, whereas forced alignment by transcriptional similarity may erase genuine developmental delays. Studies should retain both actual time and inferred state, and specify whether comparisons are made at the same time or the same stage. Both questions are valid, but researchers cannot switch arbitrarily between them after results emerge.作者分析与复核建议 / Author analysis
Batch correction must not erase the subject of study
Integration algorithms can reduce technical differences, but may also compress genuine donor, disease, or treatment effects. Evaluation should consider not only whether batches mix evenly, but also whether known biological relationships and independently measured functions are preserved. If an algorithm uses treatment labels to optimize integration, subsequent significance testing requires particular care. Results in both the original and integrated spaces should be disclosed, rather than presenting only the smoothest plot as evidence of success.作者分析与复核建议 / Author analysis
Transcriptional similarity and functional similarity
Similar expression states can support hypotheses about cell identity and processes, but function also requires morphology, electrical activity, migration, or other appropriate endpoints. Different functions require different measurements; a single marker combination cannot stand in for all aspects of maturity. This article recommends presenting molecular, structural, and functional evidence separately and prioritizing their linkage in the same subjects or explicitly paired samples. The strongest evidence from separate experiments cannot automatically be assembled into complete equivalence.作者分析与复核建议 / Author analysis
Space within organoids
Cell location and nutrient and oxygen gradients may affect state and survival. Single-cell dissociation loses some spatial relationships and may preferentially recover certain cells. Studies should compare spatial characterization, dissociation bias, and cell recovery rates, and document regions that cannot be measured. Even when average composition appears stable, internal organizational relationships may differ; spatial structure and cell inventories should therefore be treated as complementary subjects.作者分析与复核建议 / Author analysis
Donors and genetic backgrounds
Donor differences can help test generalizability, but may also coincide entirely with treatment groups and create confounding. Designs should, wherever possible, use paired or balanced comparisons across multiple independent backgrounds and clarify the hierarchy among clones, cell lines, and donors. Multiple clones do not always equal multiple independent donors, and identical genetic backgrounds do not guarantee identical treatment histories. Reports must preserve these relationships rather than obscure them with a single total sample count.作者分析与复核建议 / Author analysis
Within-batch and between-batch effects
Treatment differences within a batch may be highly reproducible, yet differ in direction between batches, indicating that effects depend on conditions. Results for each independent unit and interactions should be shown, rather than only an overall mean. If a model's conclusion derives mainly from one batch, its scope should be narrowed. The value of replication is not to make every curve identical, but to identify the backgrounds in which an explanation holds or fails.作者分析与复核建议 / Author analysis
Missingness and survival selection
Only some cells or organoids may enter the analysis after treatment because of differences in growth, survival, or dissociation. If the most affected subjects disappear, survivors appearing “more normal” does not mean that treatment improved the population as a whole. Studies should track subjects from the starting population to the analyzable population, record failures, missingness, and their causes, and conduct sensitivity analyses under different missingness assumptions. Exclusion of low-quality results requires rules fixed in advance, rather than selection according to whether results support the conclusion.作者分析与复核建议 / Author analysis
The gap between disease modeling and clinical disease courses
An abnormality in a specific cellular process can offer clues to disease mechanisms, but cannot represent the entire disease course or drug response of a whole individual. In vitro exposure, developmental stage, and tissue environment differ from clinical conditions. This article provides no diagnostic or treatment advice and does not present predictions of organoid responses directly as therapeutic efficacy in humans. Translational research requires additional models and clinical evidence, with the assumptions added at each step made explicit.作者分析与复核建议 / Author analysis
Validating AI-based atlas mapping
AI can project new data onto a reference, but a model may also force unknown states into the nearest known category. Rejection of classification or recognition of novel states should be allowed, and calibration tested on unseen protocols, laboratories, and donors. Randomly holding out cells within the same atlas is insufficient to demonstrate transfer across experiments. Confidence in mapping requires independent biological evidence and cannot be validated solely through distances on the plot itself.作者分析与复核建议 / Author analysis
How the analytical figures can be recalculated
The variance of a nested mean can be verified by summing the covariance matrix, and the compositional counterexample by weighting each term. All inputs are explicitly labeled as hypothetical; no real donor or cell data are used. The figure can demonstrate that sampling hierarchies and mixtures alter statistical results, but cannot determine whether a particular organoid is “sufficiently similar” to the human body. Real applications also require observable criteria that can fail, established for the specific process.作者分析与复核建议 / Author analysis
Ethics and research objectives
Neural organoids, donor materials, and derived data involve relevant permissions and review, and research value should be tied to explicit questions and scope. Model complexity does not justify arbitrary claims of a complete organ or consciousness, nor can public attention serve as functional evidence. This article performs only a source review and analysis; it does not generate cells or conduct biological experiments. Sharing real data still requires preserving lawful-use boundaries and source traceability.作者分析与复核建议 / Author analysis
Falsifiable directions for improvement
A better protocol should improve the reproducibility of prespecified processes in unseen donors and independent batches while preserving relevant state diversity. Tidier plots after integration do not establish that a model is better if independent functional prediction is lost. Composition, within-type state, and function should be defined as separate endpoints, and the results that would overturn the current interpretation specified in advance.作者分析与复核建议 / Author analysis
Conclusions and research package
The research package should retain donor and clone hierarchies, batches, time, protocols, the recovery funnel, versions of original and integrated data, and functional endpoints. Organoid reliability comes from clear, verifiable explanatory power for a particular question, not from the assumption that greater complexity brings a model closer to a complete human body. Connecting statistical hierarchies, developmental coordinates, and functional evidence enables large-scale atlases and detailed mechanistic studies to reinforce one another.作者分析与复核建议 / Author analysis
Core equations and derivations
(1) A simplified nested model of donors, organoids, and cells.
LaTeX
Y_{jkm}=\mu+u_j+v_{jk}+\epsilon_{jkm}(2) Assumption of an independent, balanced hierarchy; denser cell sampling cannot eliminate donor variance.
LaTeX
\operatorname{Var}(\bar Y)=\tau_D^2/J+\tau_O^2/(JK)+\sigma^2/(JKm)(3) Overall expression can change solely through cell composition.
LaTeX
\mu_{\rm bulk}=\sum_c\pi_c\mu_c(4) A pure composition effect with fixed within-type means, not a general decomposition of differences.
LaTeX
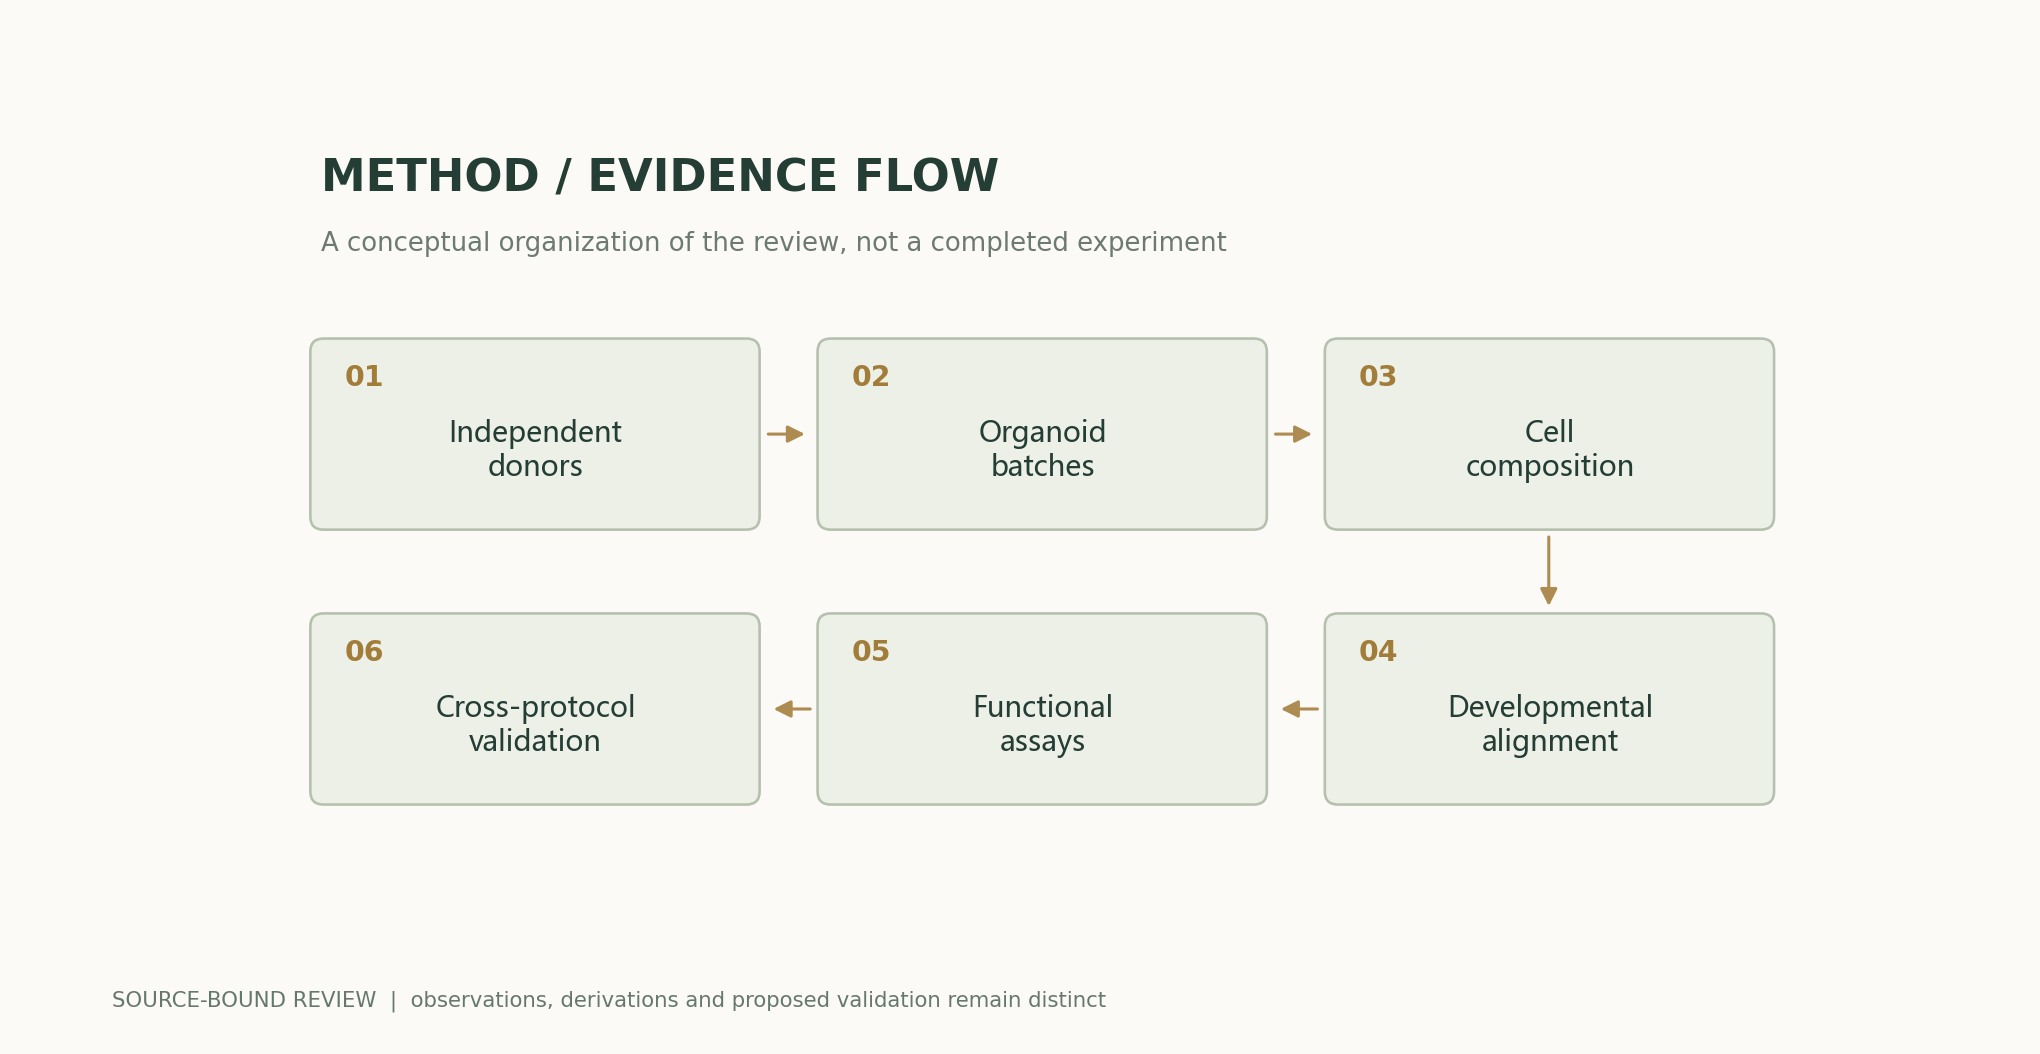
\Delta\mu_{\rm bulk}=\sum_c(\pi_{c,2}-\pi_{c,1})\mu_cMethods and evidence workflow
Analytical figures and numerical examples
Recalculable worked example
With J=6 and K=3, as m tends to infinity the variance remains 1/6+0.5/18. The proportion of the first type changes from 0.3 to 0.7, and overall expression changes from 2.4 to 1.6, while within-type means remain unchanged.
Comparison of methods
| Method or basis of assessment | What it directly constrains | Evidence still needed |
|---|---|---|
| Number of single cells | Resolution of states and composition | Independent donors and batches |
| Atlas mapping | Similarity to reference states | Functional and developmental equivalence |
| Batch integration | Handling technical differences | Preservation of genuine biological variation |
| Molecular markers | Clues to identity | Processes such as migration and electrical activity |
| Comparison at the same number of days | Effects of actual time | Differences in maturation rate |
| Comparison at the same stage | State differences conditional on stage | Developmental delays potentially removed |
Verification and experimental plan
- Confirm material permissions and define the process under study.
- Record donor, clone, organoid, and batch hierarchies.
- Retain both actual time and inferred stage.
- Track missingness from starting subjects to analyzable subjects.
- Compare composition and within-type states separately.
- Check preservation of biological effects before and after integration.
- Validate functional predictions on unseen donors and protocols.
- Disclose lawfully shareable summaries, errors, and the exact analysis version.
Scope and limitations
- No new organoids, cells, or functional experiments.
- Nested variance assumes an independent, balanced structure.
- Expression similarity does not equal complete tissue function.
- Atlas cell counts do not replace independent biological replicates.
- In vitro model results cannot be treated directly as therapeutic efficacy in humans.
Evidence from the original studies and its scope
| Original study results | Scope | Source and location |
|---|---|---|
| Assembly of different forebrain spheroids enables the study of migration and functional integration. | Specific regions and developmental processes. | Assembly of functionally integrated human forebrain spheroidsAbstract; Figs. 2–4 |
| The neural-organoid atlas organizes multiple datasets and protocol differences. | A reference resource that does not automatically establish functional equivalence. | An integrated transcriptomic cell atlas of human neural organoidsAbstract; atlas integration |
Research questions worth testing
- Does adding donors or cells reduce the target error more effectively?
- Does atlas integration erase genuine developmental delays?
- Which independent functional endpoints can molecular similarity predict?
Primary sources and the claims they support
- Assembly of functionally integrated human forebrain spheroidsFikri Birey, Jimena Andersen, Christopher D. Makinson, Saiful Islam, Wu Wei, Nina Huber, et al. · 2017-04-26Abstract; Figs. 2–4
- An integrated transcriptomic cell atlas of human neural organoidsZhisong He, Leander Dony, Jonas Simon Fleck, Artur Szałata, Katelyn X. Li, Irena Slišković, et al. · 2024-11-20Abstract; atlas integration and protocol comparisons
Citation and manuscript export
BibTeXRISCSL JSONTXTArticle JSON
Author, version, and sources
A sourced research review and original analysis written by Codex (AI). Experiments in the original papers belong to the original research teams; calculations in this article test only the listed equations and explicit assumptions. This site currently has no record of independent peer review or original model, clinical, or physical experiments for this article.
First publication: an in-depth interdisciplinary feature on scientific evidence, preserving section-level sources and the boundaries between original research evidence and the author's analysis.
The conceptual cover was generated by ImageGen. Scientific figures were plotted using the accompanying code and numerical files; their captions specify assumptions and measurement definitions item by item.
Sources of the cover and scientific figures · Data, sources, and assumptions · Python · Code for recalculation · Publication and version history
Source revision: 500575872cce7c4b9c4062a12bb0692eb580c2da