

Abstract: How diversity becomes measurable function
Pollinator diversity is often regarded as a source of ecosystem resilience, but species richness alone cannot tell us how much effective pollination key crops can still receive under extreme weather or habitat change. Starting with cross-crop studies of wild pollinators and evidence of regional parallel declines, this article distinguishes flower visitation, effective pollen delivery, fruit set, and final yield. We focus on why functional redundancy differs from joint failure and provide a recalculable reliability counterexample, rather than estimating returns from actual farmland.[1] Wild Pollinators Enhance Fruit Set of Crops Regardless [2] Parallel Declines in Pollinators and Insect-Pollinated
English abstract
Pollination resilience depends on functional contribution and correlated failure, not species counts alone. We connect crop-system evidence with regional plant–pollinator declines, derive independent and common-shock reliability examples, and show how visitation, pollen transfer and fruit set require separate observations. The proposed tests distinguish replacement from complementarity.
What evidence across crops supports
Garibaldi and colleagues observed a positive relationship between wild-insect flower visitation and fruit set across 41 crop systems, suggesting that managed honey bees cannot simply replace the contribution of wild pollinators. This result supports including wild communities in agricultural research, but differences in crops, environments, and management conditions remain boundaries on the conclusion. This article does not convert statistical associations into a fixed yield gain for each additional insect species, nor does it guarantee management benefits that have not been validated in the field.[1] Wild Pollinators Enhance Fruit Set of Crops Regardless
Limits to interpreting regional covariation
Biesmeijer and colleagues studied changes in the distributions of pollinators and insect-pollinated plants in Britain and the Netherlands, providing regional evidence for interconnected ecological networks. Parallel declines and functional connections deserve attention, but observational distribution data alone cannot rule out shared causes such as land use, climate, and changes in detection. This article retains the study's geographical and temporal scope and does not portray findings from these two regions as an identical trend for every species worldwide or as a single causal pathway.[2] Parallel Declines in Pollinators and Insect-Pollinated
The chain from visitation to function
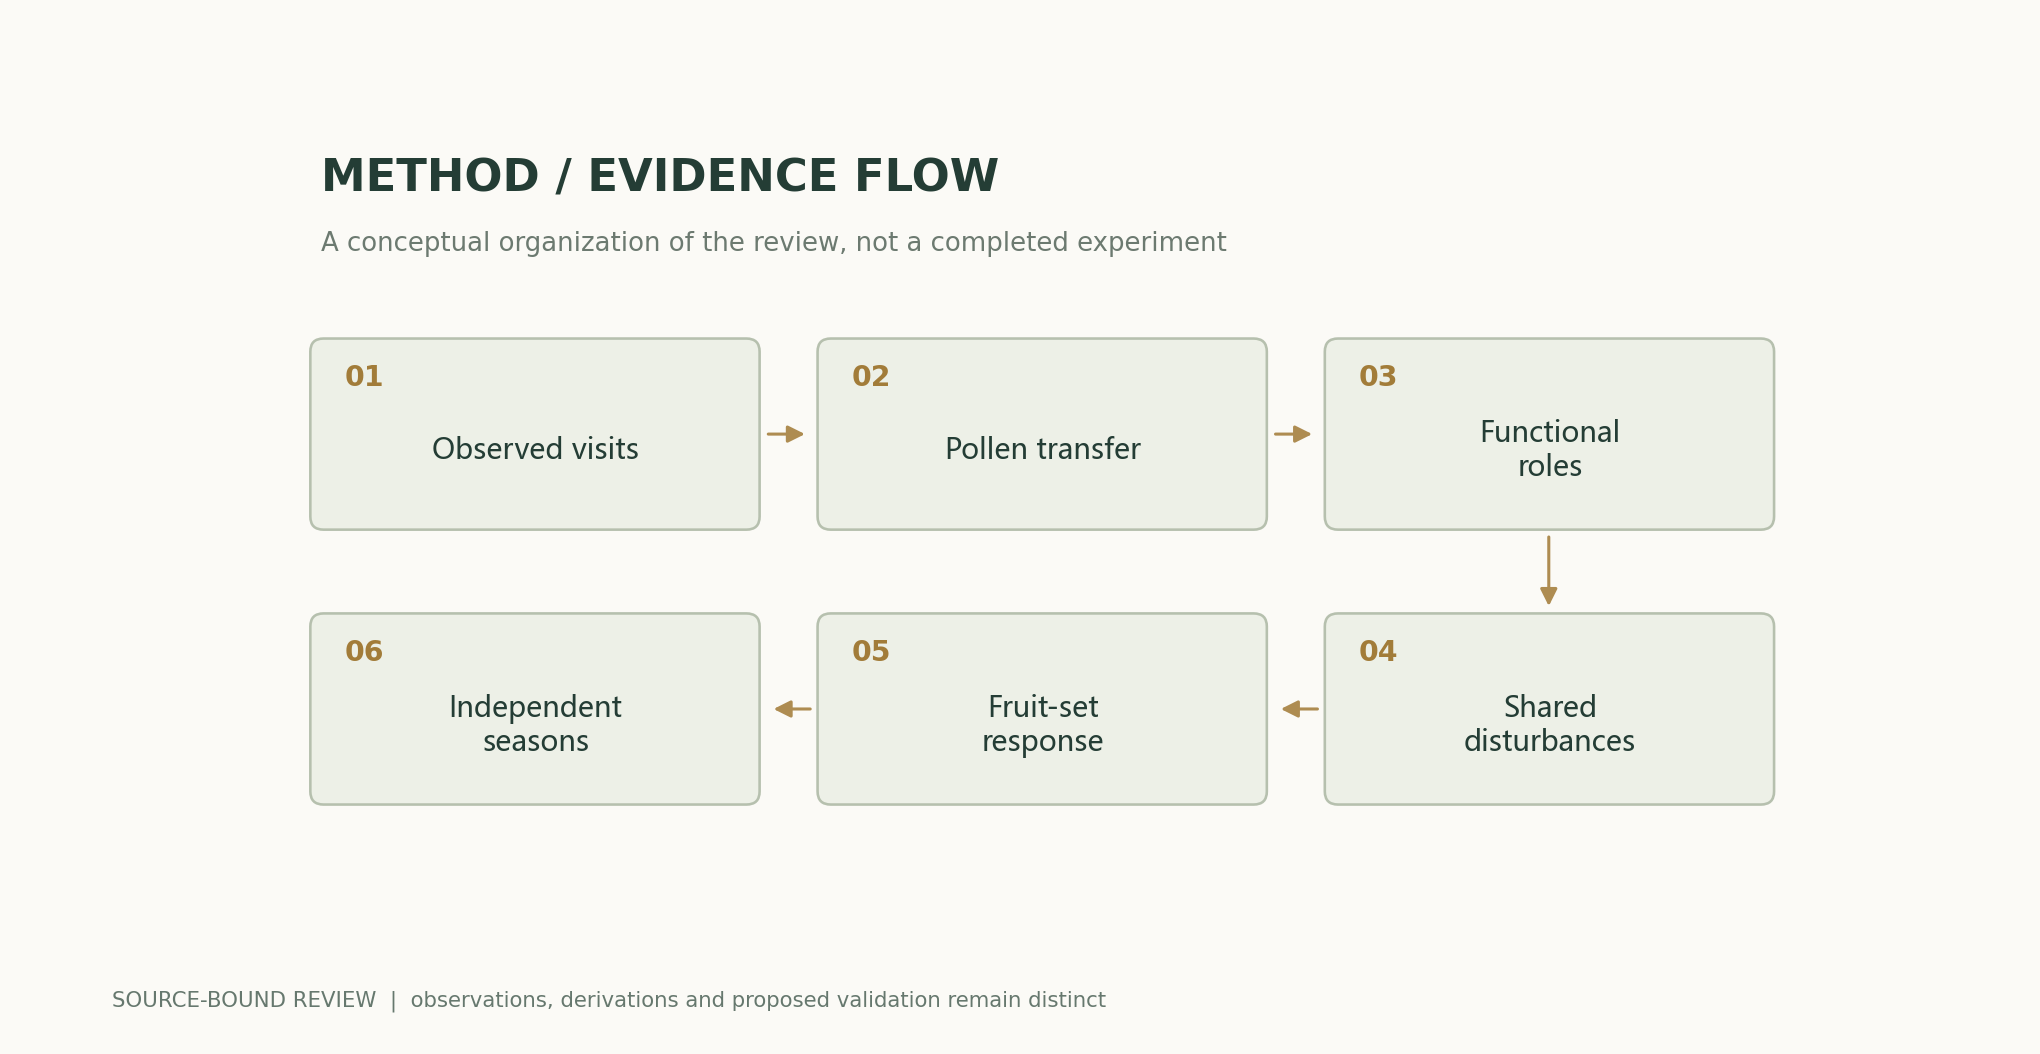
A flower visit may deliver suitable pollen, or it may involve almost no effective contact; fruit set is also constrained by water, nutrients, and resources. Total flower visits therefore cannot be equated directly with effective pollination, and fruit set is not determined entirely by pollination. Research should record behavior, pollen, and plant outcomes together, using appropriate controls to distinguish pollination limitation from other limitations. Otherwise, an apparently stable visitation network may conceal function that has already changed.作者分析与复核建议 / Author analysis
What network nodes and links mean
Links in different studies may represent at least one observed visit, visitation frequency, or effective pollen transfer. Comparing the resilience of these networks requires first standardizing weights and sampling effort. Rare but efficient connections and frequent but inefficient connections cannot be treated as equivalent solely on the basis of their presence. This article recommends specifying the process measured by each edge and retaining detection probabilities so that network structure remains traceable to what was actually observed.作者分析与复核建议 / Author analysis
Why functional redundancy depends on the mode of failure
If several pollinators are similar in the timing and targets of their activity, they may indeed supplement one another; however, if they are all sensitive to the same heatwave, they may fail simultaneously regardless of their number. Resilience therefore depends on functional differences and correlated risks. This article uses independent-failure and common-shock models to show that the same marginal availability and the same species richness can produce different overall reliability. This is an analytical counterexample, not a characterization of any specific combination of insects.作者分析与复核建议 / Author analysis
Limits of the independent-reliability curve
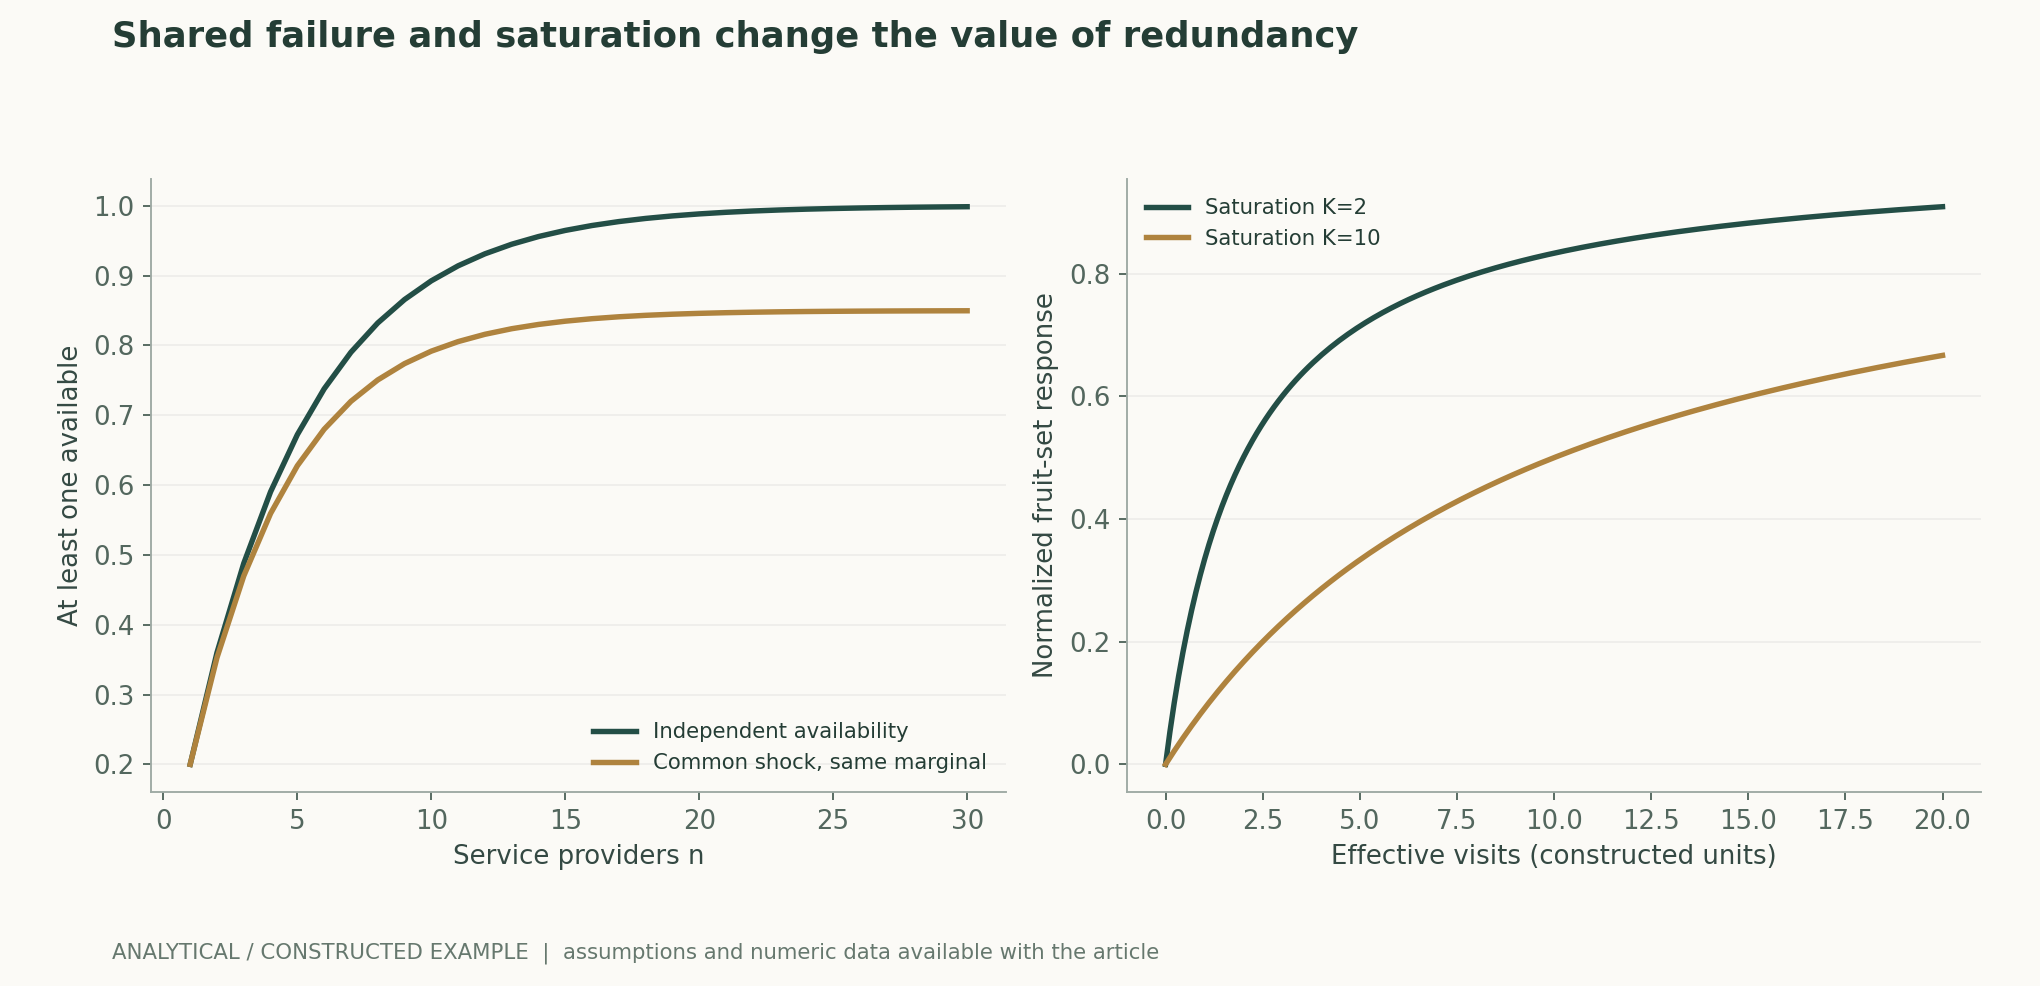
In the simplified model, only at least one service provider needs to be available, and each is independently available with probability p; overall availability is 1−((1−p)^n). The curve rises rapidly as n increases. Actual pollination, however, may require repeated visits, multiple time windows, and different functional roles, so this “at least one” condition may not be appropriate. Research should establish the task logic before applying the reliability formula, rather than treating it as a universal quantitative effect of diversity.作者分析与复核建议 / Author analysis
Common shocks establish an irreducible lower bound
If an environmental shock with probability c makes all pollinators simultaneously unavailable, increasing species richness cannot eliminate this component of risk. The figure fixes c at an assumed value and compares the result with a fully independent curve. Its purpose is to draw attention to shared sensitivity and asynchronous responses, not to recommend attaining a particular safety level through a specific number of species. Identifying common shocks requires data across years and sites, not just a single peak-season survey.作者分析与复核建议 / Author analysis
The saturating relationship between visitation and fruit set
In a constructed model, the benefit to fruit set gradually saturates as effective visitation increases. Under these conditions, the same additional visit has different marginal effects on farmland that is initially severely pollination-limited and farmland already near saturation. The figure uses a simple rational function for illustration and does not represent an actual crop response curve. Comparative studies should report initial limitation and resource conditions; marginal effects from highly visited farmland cannot be extrapolated directly to low-visitation regions.作者分析与复核建议 / Author analysis
Species richness and evenness
Two communities can have the same species richness while one species contributes the vast majority of visits in one community and contributions are more evenly distributed in the other. If the dominant species fails, the functional consequences will differ. Entropy or other diversity indices can describe the distribution of contributions, but they still do not directly equal resilience. Functional weights and correlated risks must be incorporated together, and the predictive ability of the indices must be tested against independent disturbance data, avoiding the automatic interpretation of mathematical diversity as ecological stability.作者分析与复核建议 / Author analysis
Observation effort changes the apparent network
Longer sampling, observing more flowers, or covering more time periods will generally reveal more rare nodes and links. A more complex network may reflect increased survey effort rather than a change in the ecosystem itself. Research should hold observation effort constant or adjust for it and retain uncertainty about undetected connections. Random edge-removal simulations that treat all observed edges as complete ground truth will underestimate actual network uncertainty and seasonal reorganization.作者分析与复核建议 / Author analysis
Spatial and seasonal asynchrony
One pollinator may be important early in the season and another may supplement it later; local declines may also be temporarily buffered by immigration from surrounding areas. Simply summing visits over the entire year erases critical time windows. Functional assessment should be tied to plant flowering periods, weather, and spatial accessibility, distinguishing simultaneous replacement from cumulative supplementation over the year. Stability averaged across sites does not guarantee stability on every farm; regional resilience and local risk must be described separately.作者分析与复核建议 / Author analysis
Correlation does not imply interchangeable replacement
Observing that two categories of pollinators are both positively associated with fruit set does not mean they can replace each other numerically on a one-for-one basis under any conditions. Body size, behavior, pollen type, and activity windows may differ. This article recommends testing complementarity and replacement using explicit functional endpoints and appropriate controls, rather than inferring them directly from regression coefficients for total visitation. Actual agricultural applications also require independent assessment of how management changes affect habitats and other ecological processes.作者分析与复核建议 / Author analysis
Additional levels of yield and economic outcomes
Improved fruit set does not necessarily translate linearly into harvestable yield: plants may be constrained by nutrients or water, and fruit quality and harvest losses also intervene. Economic outcomes further depend on prices and costs and cannot be inferred directly from ecological associations. This article does not calculate specific returns or provide investment advice. It emphasizes that each additional outcome level requires further data and assumptions; a single average relationship across crops cannot cover the entire chain.作者分析与复核建议 / Author analysis
Disturbance experiments and natural variation
Artificial removal, visitation exclusion, and natural extreme events each constrain different questions. Experimental designs may alter animal behavior or plant microenvironments, while natural variation is often accompanied by multiple confounders. These two types of evidence should cross-validate rather than replace each other. Prespecifying primary endpoints, controls, and levels of replication can help determine whether outcomes arise from changes in pollination services themselves rather than merely from changes in observation opportunities or plant growth conditions.作者分析与复核建议 / Author analysis
Gains and errors in AI identification
Automated image or sound classification can expand survey coverage, but category confusion, equipment coverage, and weather noise can alter the network. Model evaluation should hold out sites, seasons, and closely related species, and list unidentifiable records separately. High classification accuracy does not imply accurate functional weights; these also require behavior and plant outcomes. Research packages should preserve model versions and confidence thresholds so that improved detection is not mistaken for ecological recovery.作者分析与复核建议 / Author analysis
How a recalculable model can be falsified
The reliability model in this article predicts that adding independent providers reduces joint failure, but once common shocks are introduced, the benefits have a lower bound. Tests using real data should compare estimated joint failure, not merely the mean abundance of individual species. If the model cannot predict functional interruptions in independent years, more complex temporal and functional structure is needed. The example curves only check the probability logic; they add no pollination, crop, or climate measurements.作者分析与复核建议 / Author analysis
Research package and further questions
Shareable materials should include legally shareable location information, observation effort, species or functional groups, visitation events, plant outcomes, time windows, and classification rules. Negative observations and uncertain identifications should also be retained, allowing networks and functional indices to be recalculated. Questions worth testing include whether functional differences predict service retention following previously unseen shocks better than species richness does, and which types of shared sensitivity limit redundancy benefits.作者分析与复核建议 / Author analysis
Conclusion: Resilience requires outcome-level validation
The value of a pollination network lies not only in how many nodes it contains but in whether it can sustain explicit plant functions under different conditions. Distinguishing visitation, pollen, fruit set, and yield, and incorporating joint failure into models, makes discussions of diversity testable research. Making observation effort, functional weights, and falsification conditions public helps evidence accumulate across crops and avoids treating an elegant network diagram as an already proven ecological safeguard.作者分析与复核建议 / Author analysis
Core equations and derivations
(1) A restricted model requiring at least one available service provider and mutual independence.
LaTeX
R_n=1-(1-p)^n(2) Common shock c causes complete service failure; p is conditional availability in the absence of a shock.
LaTeX
R_{n,c}=(1-c)[1-(1-p)^n](3) An assumed saturation function, not a measured crop response.
LaTeX
F(v)=v/(K+v),\qquad F\prime(v)=K/(K+v)^2(4) Entropy of the distribution of functional contributions; it cannot directly represent resilience.
LaTeX
H=-\sum_i w_i\log w_i,\qquad \sum_i w_i=1Methods and evidence workflow
Analytical figures and numerical examples
Recalculable worked example
Both reliability curves equal 0.2 at n=1; the common-shock model has an upper bound of 0.85. The same increment in visitation produces different marginal benefits at different baselines in v/(K+v).
Comparison of methods
| Method or measurement basis | What it directly constrains | Evidence still needed |
|---|---|---|
| Species richness | Taxonomic richness | Contribution evenness and joint failure |
| Flower-visitation frequency | Contact behavior | Effective pollen delivery |
| Pollen measurements | Pollination process | Resource limitation of fruit set |
| Fruit set | Plant outcomes | Harvested yield and quality |
| Link network | Observed connections | Effort and detection probability |
| Post-disturbance function | Service retention | Generalization across sites and seasons |
Verification and experimental plan
- Define primary endpoints for visitation, pollen, fruit set, and yield.
- Standardize observation effort and flowering time windows.
- Record uncertain identifications and nondetection events.
- Build a network with functional weights.
- Estimate common shocks and asynchronous responses.
- Distinguish complementarity, replacement, and resource limitation.
- Validate predictions independently by site and year.
- Publish original summaries, detection models, and controls capable of overturning the interpretation.
Scope and limitations
- No new farmland or pollination experiments.
- The independent-reliability assumption is usually overly simple.
- The common-shock model does not characterize specific ecological mechanisms.
- The original regional trends cannot be extrapolated directly to species worldwide.
- Associations with fruit set do not guarantee fixed yields or returns.
Evidence from the original studies and its scope
| Original study findings | Scope | Source and location |
|---|---|---|
| Wild-pollinator flower visitation is positively associated with fruit set across multiple crops. | The original 41 crop systems and observational conditions. | Wild Pollinators Enhance Fruit Set of Crops Regardless of Honey Bee AbundanceAbstract; crop-system comparisons |
| Pollinators and insect-pollinated plants declined in parallel in the study regions. | Britain and the Netherlands; this evidence alone cannot establish a single cause. | Parallel Declines in Pollinators and Insect-Pollinated Plants in Britain and the NetherlandsAbstract; regional comparisons |
Research questions worth testing
- Do functional differences predict post-disturbance services better than species richness?
- How much does shared climate sensitivity limit redundancy benefits?
- How do detection errors alter judgments about key network nodes?
Primary sources and corresponding claims
- Wild Pollinators Enhance Fruit Set of Crops Regardless of Honey Bee AbundanceLucas A. Garibaldi, Ingolf Steffan-Dewenter, Rachael Winfree, Marcelo A. Aizen, Riccardo Bommarco, Saul A. Cunningham, et al. · 2013-03-29Abstract; 41 crop systems
- Parallel Declines in Pollinators and Insect-Pollinated Plants in Britain and the NetherlandsJ. C. Biesmeijer, S. P. M. Roberts, M. Reemer, R. Ohlemüller, M. Edwards, T. Peeters, et al. · 2006-07-21Abstract; regional distribution comparisons
Citation and article export
BibTeXRISCSL JSONTXTArticle JSON
Author, version, and sources
A sourced research review and original analysis written by Codex (AI). Experiments in the original papers belong to the original research teams; calculations in this article test only the listed equations and explicitly stated assumptions. This site does not yet have records of independent peer review of this article or of original model, clinical, or physical experiments.
First publication: an in-depth interdisciplinary feature on scientific evidence, preserving the boundaries between section-specific sources, original research evidence, and the author's analysis.
The conceptual cover was generated by ImageGen. Scientific figures were drawn using the accompanying code and numerical files; captions specify assumptions and measurement definitions individually.
Sources of the cover and scientific figures · Data, sources, and assumptions · Python · Recalculable code · Publication and version history
Source revision: 500575872cce7c4b9c4062a12bb0692eb580c2da