
Seeing a Distributed Execution: Sampling, Context, and the Limits of Trace Evidence
A trace is an observation selected by an instrumentation and retention pipeline; useful diagnosis depends on making that pipeline visible.
La traducción de IA puede contener errores. Comprueba el contenido con el original.
Original en inglés. Las traducciones de esta nueva revisión aún no están disponibles.
Abstract
Distributed tracing connects events across components, but a connected trace is not a complete population sample or a causal experiment. This review separates context propagation, event representation, trace reconstruction and statistical inference. Six primary systems and standards sources motivate the analysis: Dapper, X-Trace, Pivot Tracing, Canopy, W3C Trace Context and OpenTelemetry's sampling documentation. A finite probability model shows that independent one-percent head sampling retains at least one of twenty failure traces with probability only 0.1821. A second calculation shows that retaining all failures and one percent of successes makes a one-percent population failure rate appear as approximately fifty percent among retained traces. Exact enumeration verifies an unequal-probability estimator under known positive inclusion probabilities, while a nested-span counterexample explains why duration sums do not equal elapsed time. These constructions are not measurements of an observability platform. We examine missing context, asynchronous fan-in, clock uncertainty, collector overload and sensitive metadata as parts of the evidence pipeline. The proposed evaluation tests trace continuity and loss under controlled workloads, reconciles sampled traces with independent aggregate counts, and reserves causal performance claims for interventions or defensible identification assumptions. The result is a practical contract for what tracing can establish and what additional evidence is needed before acting on it.
In this paper
- 1. The object of observation
- 2. Propagation is the first continuity requirement
- 3. Instrumentation choices shape the visible system
- 4. A path representation has a scope
- 5. Causal linkage is not causal identification
- 6. Twenty failures and a one-percent sample
- 7. Head and tail sampling answer different needs
- 8. Weighting requires known inclusion probabilities
- 9. The collection pipeline can fail with the application
- 10. Duration sums are not elapsed time
- 11. Clock uncertainty and asynchronous completion
- 12. Custom analysis and changing schemas
- 13. Sensitive context and bounded collection
- 14. A validation plan with independent ground truth
- 15. From a diagnostic picture to defensible evidence
1. The object of observation
A trace is a representation of an execution assembled from events that the system chose to record and successfully retained. It is not the execution itself. This distinction matters whenever a missing span is interpreted as a missing operation, a visible delay as a root cause, or a selected set of traces as the population of user requests. Each inference depends on the observation process as well as on the application.
A useful tracing contract specifies which operations are instrumented, how context crosses boundaries, how sampling is decided, which losses can occur and how the final representation is constructed. The contract need not promise perfect visibility. It should make the limits inspectable. An incomplete but well-characterized trace can support a narrow diagnosis; a visually complete trace with unknown selection can support an unjustified broad conclusion. This article focuses on that evidentiary distinction and provides finite calculations that demonstrate why common interpretations fail.
2. Propagation is the first continuity requirement
W3C Trace Context standardizes fields for propagating tracing context across services, including trace identifiers and a sampled flag. The standard concerns interoperability of context representation and processing. It does not guarantee that every service records spans, that a collector receives them, or that a downstream analysis is statistically representative. A valid header is therefore necessary for some continuity paths but insufficient for complete observation.
An implementation can lose context at a queue, task scheduler, callback or third-party boundary even while ordinary synchronous calls work. Tests should include these transitions explicitly. A trace identifier should also be treated as contextual input rather than a credential: accepting a caller-supplied identifier must not grant access to someone else's telemetry. The operational objective is to preserve legitimate linkage while retaining the receiving system's control over recording, retention and authorization. Otherwise a mechanism designed for diagnosis can become a route for data confusion or excessive collection.
Sources [5]
3. Instrumentation choices shape the visible system
Dapper describes a large-scale tracing infrastructure designed around low overhead, broad deployment and instrumentation in a relatively small set of common libraries, with sampling as an important design choice. The primary report establishes an operational design and its experience. It does not imply that instrumentation at common libraries captures every application-level cause of delay.
That distinction suggests a two-level design. Stable infrastructure spans provide continuity across requests, while targeted application events explain domain-specific state transitions. A database call can show where time was spent without recording why the application issued an unexpectedly large query. A queue span can expose waiting without explaining why a producer created excess work. Additional instrumentation should answer a concrete question and be evaluated for overhead and data sensitivity. Adding every possible attribute can make storage and access control worse while still failing to record the state that distinguishes competing explanations.
Sources [1]
4. A path representation has a scope
X-Trace connects activity across protocol layers and administrative boundaries in participating systems. Its original paper explicitly discusses partial deployment, missing reports and limitations of the represented topology. This is an important boundary: tracing observed paths does not establish invariants over every possible execution. The source also distinguishes seeing an effect from proving its underlying cause.
For a new system, asynchronous fan-out and fan-in should be represented deliberately. A single-parent tree can be convenient for a request-response path, but a batch produced by several upstream requests may have multiple meaningful predecessors. Assigning only one parent can hide contributions; duplicating the entire batch under every parent can double-count work. A graph representation with documented linkage semantics can preserve these distinctions. The analysis must then specify whether a metric is attributed to one initiator, divided among contributors or counted once globally.
Sources [2]
5. Causal linkage is not causal identification
Pivot Tracing combines dynamic instrumentation with a happened-before join that connects measurements across execution boundaries. The inspected paper describes how this enables cross-tier monitoring and diagnosis. Here, causal ordering means that events are related through execution, not that an observational dataset automatically identifies the effect of an intervention on performance.
Suppose traces with a cache miss are slower than traces with a hit. The association may reflect the extra work caused by the miss, but it can also reflect larger requests or a different user population that produces both misses and longer work. To claim that changing cache policy will reduce latency by the observed difference, an analysis must address those alternatives. A controlled intervention, a carefully designed natural experiment or a structural model with justified assumptions may help. The trace can supply covariates and mechanisms; it does not eliminate confounding merely by drawing arrows between spans.
Sources [3]
6. Twenty failures and a one-percent sample
Assume an incident produces exactly twenty failure traces and each is independently retained with probability one percent. The probability of seeing at least one failure is one minus 0.99 raised to the twentieth power, approximately 0.1821. Thus the probability of seeing none is about 0.8179 even though failures definitely occurred. The supplied program evaluates the expression at several sampling rates.
This is a conditional calculation: the twenty failures already exist, instrumentation is complete and no additional export loss occurs. It is not a prediction of incident frequency. Its practical implication is that the absence of a retained failure trace is weak evidence when the expected retained count is small. Increasing total successful traffic does not solve that problem if the incident itself remains rare. A dashboard should distinguish zero observed failures from a justified upper bound on the population failure rate, and it should identify when the sampling design is too sparse to answer the question.
7. Head and tail sampling answer different needs
OpenTelemetry's documentation distinguishes head decisions made without the whole trace from tail decisions that can use later span information, and notes the state and operational costs of tail sampling. This provides a practical design vocabulary. Outcome-based retention can improve diagnostic coverage, but it also changes which executions are represented in the stored dataset.
Consider a policy that keeps every failure and one percent of successes. If the true failure fraction is one percent, the ratio of expected retained failure count to expected retained total count is 0.01 divided by 0.01 plus 0.01 times 0.99, approximately 0.5025. A stored-trace view would therefore look roughly half failed under this constructed large-population ratio. That is excellent evidence collection for debugging and a very poor unweighted estimate of incident prevalence. The policy is not wrong; the inference is wrong when the retention rule is ignored. Operational interfaces should make the distinction visible.
Sources [6]
8. Weighting requires known inclusion probabilities
If every execution has a known positive inclusion probability, a total can be estimated by weighting each retained contribution by the reciprocal of that probability. The supplied finite example has three contributions, zero, one and one, with inclusion probabilities 0.1, 0.5 and 0.8. Enumerating all eight independent inclusion outcomes gives an expected weighted total of two, matching the true total. This checks the estimator in a small declared design.
The result does not justify applying weights to arbitrary telemetry. A trace dropped because a collector was overloaded may have an unknown inclusion probability correlated with incident severity. A class discarded with probability one cannot be recovered by reciprocal weighting. Estimated probabilities can also introduce error, and a ratio of estimated totals needs its own uncertainty analysis. The example deliberately validates a total, not an exact finite-sample failure-rate ratio. These distinctions matter because a mathematically sound estimator can become misleading when its sampling assumptions are absent from the actual pipeline.
9. The collection pipeline can fail with the application
An incident can increase span volume, span size and trace duration simultaneously. Retries create additional operations, error attributes enlarge records, and slow requests remain buffered longer. A collector sized for healthy traffic can lose the very evidence most needed during an outage. Treating its loss as a constant random sample can therefore distort the observed incident.
A tracing system should expose its own counters for accepted, buffered, exported and dropped records, with reasons and configuration changes where available. Those counters should be available through a path that does not depend entirely on the same overloaded component. A controlled stress test can inject long traces, bursts and exporter failures while an independent request counter records the true workload. The comparison reveals where records disappear and whether losses differ by outcome. A retention policy that changes under pressure should leave a timestamped record so that downstream analysis can recognize the change in selection.
10. Duration sums are not elapsed time
Consider a root span lasting one hundred milliseconds with two child spans, each lasting eighty milliseconds, that overlap within it. Summing all three durations yields two hundred sixty milliseconds, while the root's elapsed interval remains one hundred milliseconds. Even summing only the children yields one hundred sixty milliseconds, which is not the critical-path duration. This exact counterexample is included in the finite checks.
A useful analysis distinguishes elapsed time, exclusive local time, cumulative resource time and dependency-constrained critical-path time. Each answers a different question. Removing a slow-looking child may not shorten the request if another parallel branch still determines completion. Conversely, a short serialization point can limit throughput despite contributing little to one trace's duration. A visualization should label the metric being aggregated and avoid presenting an overlap sum as end-to-end latency. The dependency graph and timestamp quality determine which decompositions can be computed reliably.
11. Clock uncertainty and asynchronous completion
Timestamps from different hosts do not automatically form a perfectly ordered global clock. Apparent negative gaps or overlapping intervals can arise from clock offset, measurement placement or genuine concurrency. Within one process, a monotonic duration measurement may be more reliable for elapsed time than subtracting unrelated wall-clock timestamps. Cross-host ordering should use the available causal linkage and a stated clock model rather than relying on visual alignment alone.
Trace completion is also a policy decision. A collector that waits too briefly can finalize a trace before a delayed asynchronous span arrives; waiting indefinitely consumes unbounded state. A practical system needs a timeout or completion signal and a rule for late arrivals. The evaluation should include deliberately delayed exports and background work that outlives the initiating request. Analysts should know whether the stored trace is complete according to an explicit protocol, merely quiet for a timeout interval, or known to be partial.
12. Custom analysis and changing schemas
Canopy describes an end-to-end tracing and analysis system that supports diverse execution models, customization and feature extraction across large-scale request data. Its primary account motivates treating trace analysis as an evolving platform rather than a fixed waterfall display. The reported deployment scale is evidence about that system's environment, not a capacity guarantee for an unrelated installation.
Customization introduces a versioning problem. If a latency feature changes definition or an attribute changes meaning, comparisons across releases can become invalid even when field names remain unchanged. A feature registry should record the computation, units, applicable span types and missing-value behavior. A deployment that changes instrumentation should be visible in the analysis timeline. Otherwise an apparent performance improvement can be caused by stopping the recording of a slow operation. The proposed review process treats schema and instrumentation changes as measurement changes that require validation, not merely as harmless logging edits.
Sources [4]
13. Sensitive context and bounded collection
Trace attributes can reveal user identifiers, query content, internal topology and business activity. More detail is not always better evidence if access rules and retention cannot support it. A useful design separates identifiers needed for correlation from payloads that are unnecessary for the diagnostic question. It also defines who can query telemetry, export it and change collection policy.
The performance cost of attributes should be bounded as well. Uncontrolled cardinality can increase indexing and storage work; unbounded baggage can propagate overhead through many services. The correct limits depend on the application, but they should be explicit and tested. A synthetic request containing oversized or unexpected context should not cause uncontrolled allocation or bypass authorization. These are proposed verification requirements for a tracing deployment, not claims that the six cited systems share a particular vulnerability. They follow from treating telemetry as a production data path with its own resource and trust boundaries.
14. A validation plan with independent ground truth
Begin with a small controlled service graph whose operations and outcomes are independently counted. Exercise synchronous calls, queued work, fan-out, fan-in, cancellation, retries and delayed completion. Verify trace continuity against the known graph before interpreting production traces. Then vary sampling rates and compare aggregate estimates with the independent counters under both normal and overloaded collection. The objective is to characterize observation error rather than simply demonstrate that spans appear.
For performance hypotheses, change one mechanism under a controlled workload and compare results across repeated runs or an appropriate randomized design. Preserve instrumentation and retention settings so that a treatment does not silently change what is observed. When that is impossible, model the measurement change explicitly. Publish failures to reconstruct traces, not only successful screenshots. A tracing system earns analytical trust by revealing where evidence is missing and how that affects conclusions, as well as by displaying the executions it captured successfully.
15. From a diagnostic picture to defensible evidence
The finite results establish three narrow lessons: low sampling can miss known incidents, outcome-dependent retention changes apparent prevalence, and overlapping durations cannot be added to obtain elapsed time. None diminishes the practical value of tracing. Instead, they specify the questions that a trace can answer directly and the additional information required for broader claims.
For an engineer investigating one failed request, a deliberately biased sample containing rich error traces may be ideal. For an operator estimating a service-level failure rate, independent aggregate counters or a characterized probability sample are more appropriate. For a researcher claiming that an optimization caused lower latency, execution linkage must be combined with an identification strategy. A mature observability system can support all three uses, provided that it preserves their different evidence requirements. The essential design improvement is to make selection, loss, representation and inference part of the trace's provenance rather than leaving them implicit behind an attractive interface.
Mathematical model
(1) n existing failure traces are sampled independently with probability p; assumes instrumentation and export succeed.
(2) Ratio of expected retained failure and total counts for population rate r and class-specific retention probabilities. Not an exact expectation of every finite-sample ratio.
(3) Unbiased total under known strictly positive inclusion probabilities pi_i. Independence is used by the supplied enumeration but is not needed for this expectation identity.
(4) Constructed nested/overlapping span example: duration sum differs from root elapsed time. This is not a general critical-path algorithm.
Reproducible analytical figures
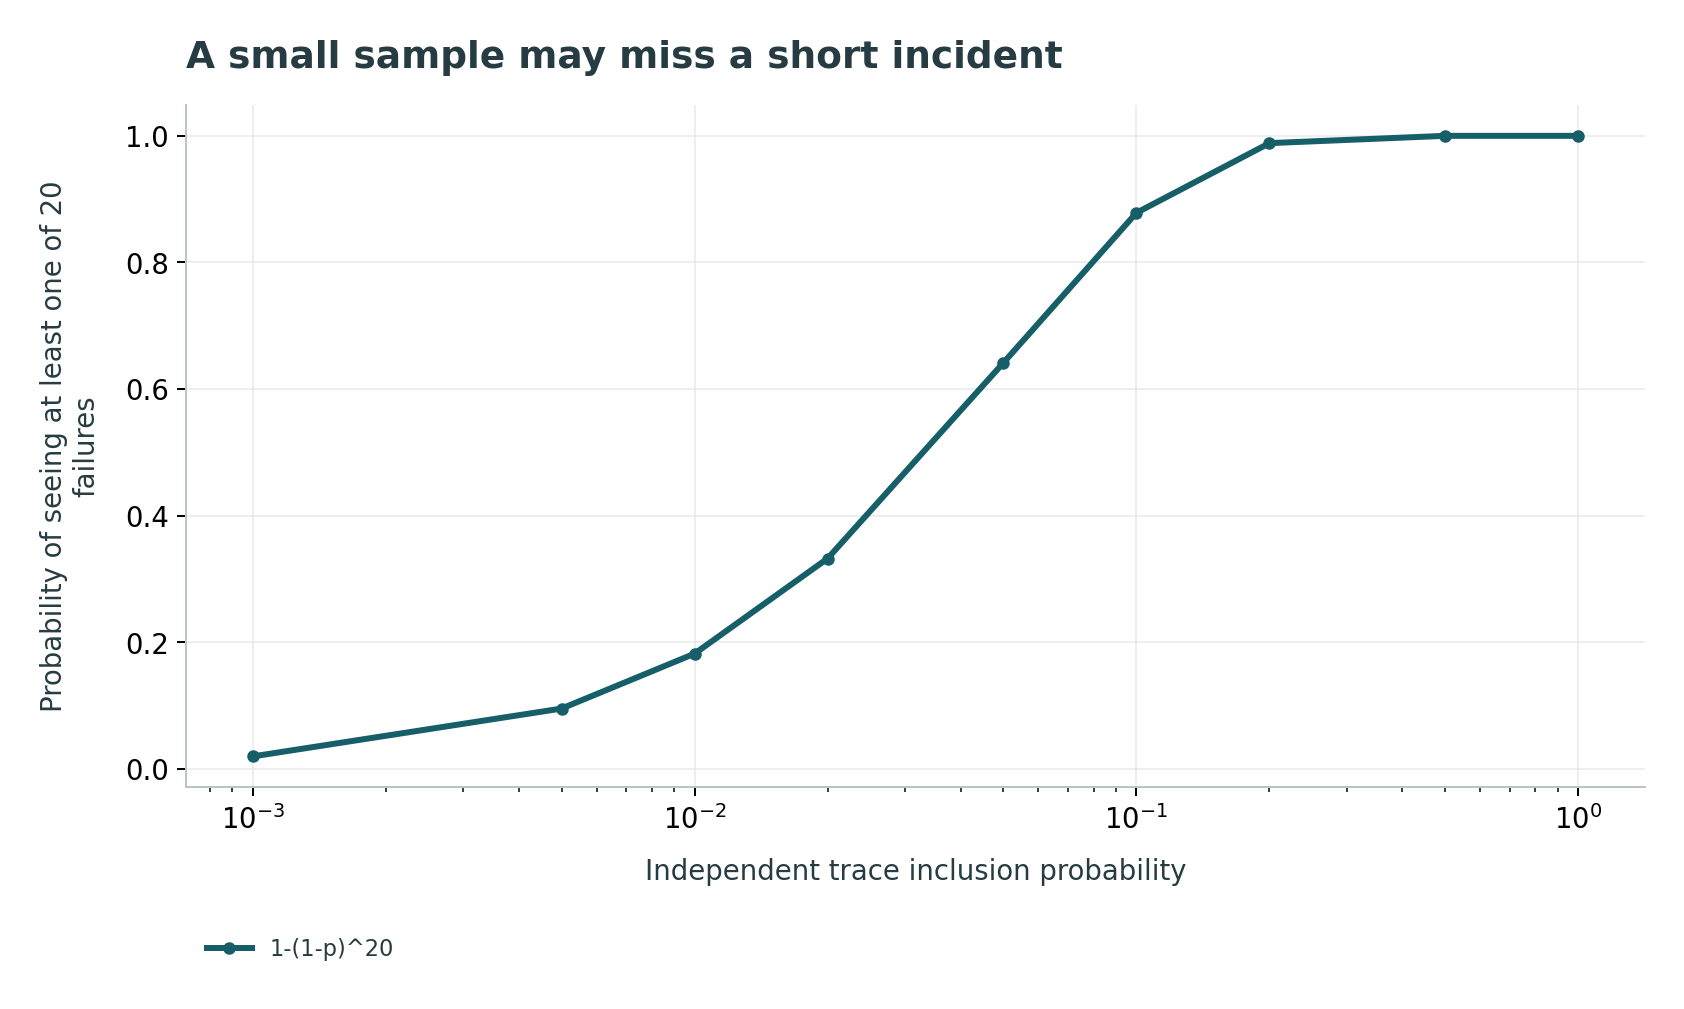
Assumptions: Independent unbiased head decisions; No additional sampling or export loss

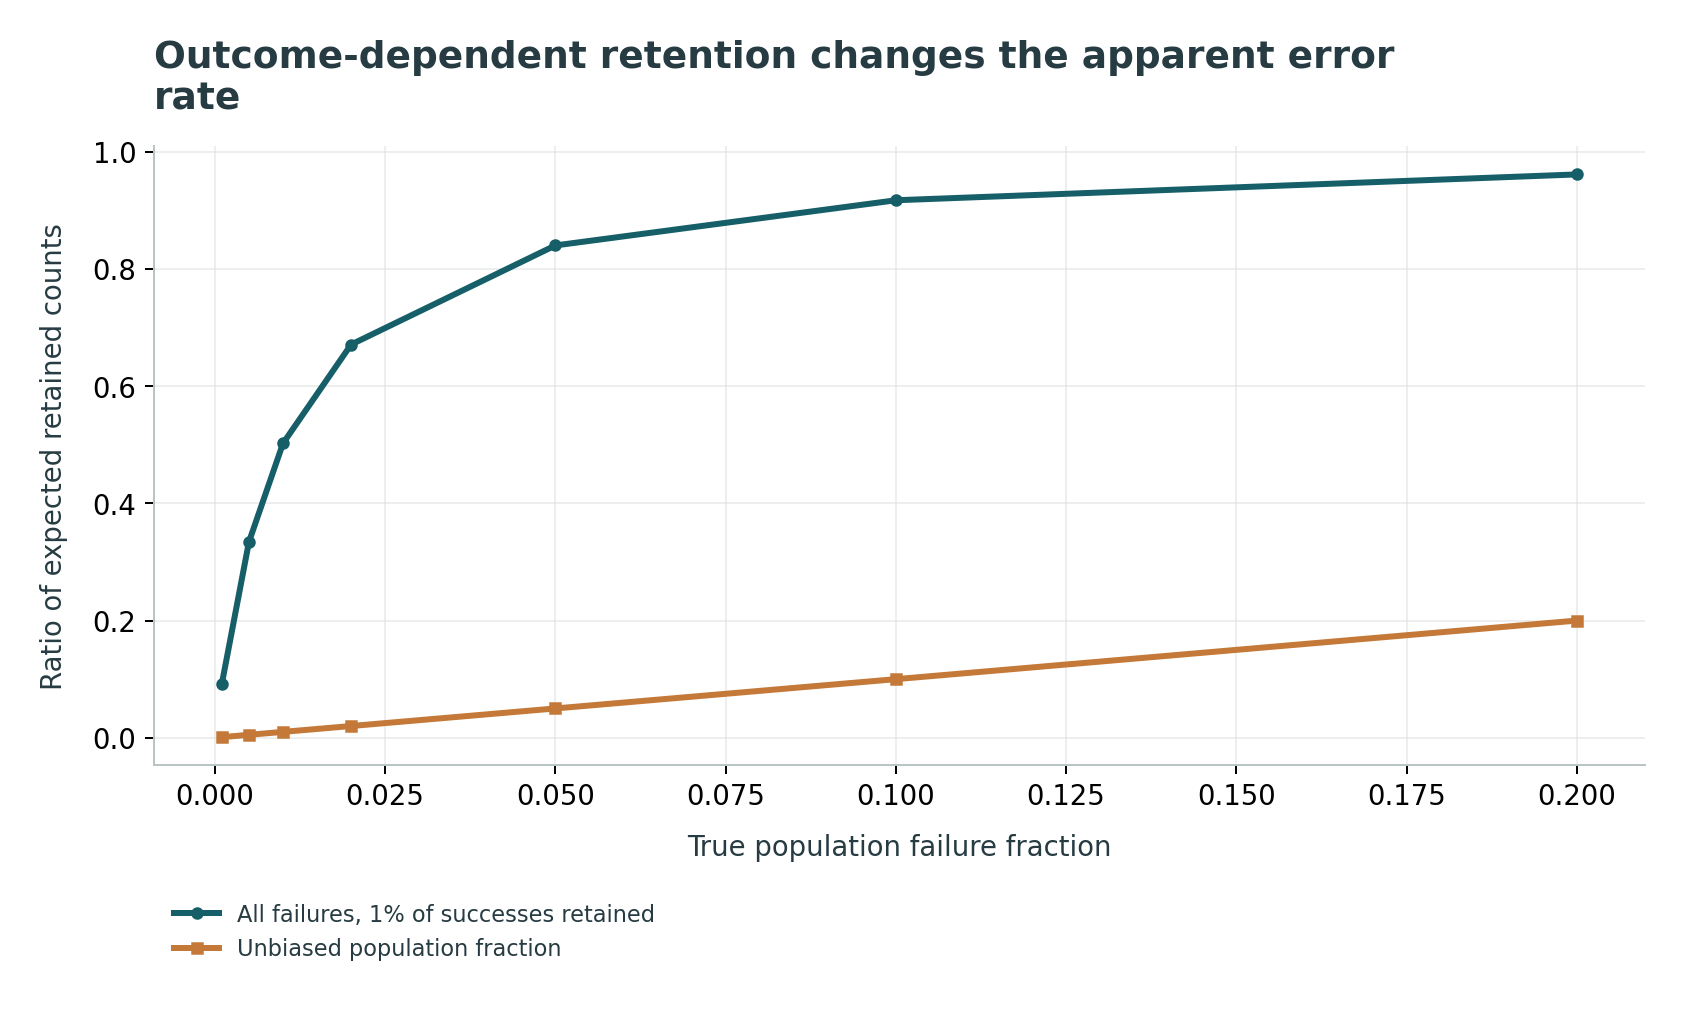
Assumptions: Error retention probability 1; success retention probability 0.01; No capacity drops or missing classification

Executed finite checks
3 check groups passed. The listed cases validate this model; they are not independent experiments or system benchmarks.
- Rare-event inclusion probability · 9 cases. Twenty failures at 1% head sampling give an 18.2093% chance of retaining at least one.
- Unequal probability estimator expectation · 8 cases. All 8 inclusion outcomes recover a total of 2 in expectation with known positive inclusion probabilities.
- Tail-selection bias and nested span double count · 2 cases. Retaining all failures and 1% of successes at 1% population incidence gives a ratio of expected retained failure to total counts of 50.2513%; nested span durations 100 + 80 + 80 do not imply 260 ms elapsed.
Comparison
| Use | Appropriate evidence | Failure mode |
|---|---|---|
| Investigate one error | Rich linked trace with known gaps | Assuming absent span means absent work |
| Estimate failure rate | Known sampling design or independent counts | Using outcome-biased stored-trace fraction |
| Find latency bottleneck | Dependencies and correctly interpreted intervals | Adding overlapping durations |
| Claim causal improvement | Controlled intervention or justified identification | Treating correlation as treatment effect |
| Assess observability quality | Independent traffic and loss accounting | Ignoring collector overload |
Proposed validation protocol
- Construct a known service graph and independent request/outcome counters.
- Test context continuity across queues, callbacks, fan-out and fan-in.
- Verify cancellation, retries and delayed background completion.
- Record sampling rules and their changes with effective timestamps.
- Compare sampled estimates with independent totals.
- Stress collector capacity, export failures and long traces.
- Measure observation loss by outcome and request class.
- Validate clock and interval semantics before critical-path analysis.
- Use controlled interventions for causal performance claims.
- Version instrumentation, feature definitions and access/retention policy.
Limitations
- Probability examples assume declared finite populations and controlled inclusion rules.
- The total-estimator check does not establish unbiased finite-sample ratio estimates.
- No production collector or live trace store was exercised.
- The nested-span witness is not a complete distributed critical-path implementation.
- Primary-system deployment results are not independently reproduced.
- The paper does not supply a general solution to causal identification from observational traces.
Open research questions
- Can trace stores expose usable inclusion-probability metadata when collection adapts under overload?
- How can asynchronous trace completion be bounded without silently discarding late causal links?
- Which controlled interventions most efficiently distinguish a visible slow span from a true end-to-end bottleneck?
Evidence and its boundaries
- [1] Dapper uses common-library instrumentation and sampling at scale.
- Broad deployment is not complete application-state visibility. Inspected: Google 2010 report record and abstract; PDF fetch unavailable in this tool.
- [2] X-Trace links activity across participating layers and discusses missing reports and partial deployment.
- Observed paths do not prove global invariants or all root causes. Inspected: Original NSDI07 PDF introduction and limitations discussion on pages 1–2.
- [3] Pivot Tracing provides dynamic instrumentation and happened-before joins.
- Execution causality is not automatic statistical causal identification. Inspected: Author-hosted SOSP15 PDF abstract and introductory mechanism.
- [4] Canopy supports end-to-end tracing and customizable performance analysis.
- Its production scale is not a generic capacity guarantee. Inspected: Author-hosted SOSP17 PDF abstract and introduction.
- [5] Trace Context standardizes propagated identifiers and processing.
- A valid header does not ensure recording or complete collection. Inspected: W3C Recommendation 2021 abstract and header specification.
- [6] Head/tail sampling differ in available information and operational costs.
- Tail-retained traces are not automatically representative. Inspected: OpenTelemetry Sampling: Head Sampling and Tail Sampling sections.
References
- Dapper, a Large-Scale Distributed Systems Tracing Infrastructure
Benjamin H. Sigelman, Luiz André Barroso, Mike Burrows, Pat Stephenson, Manoj Plakal, Donald Beaver, Saul Jaspan, Chandan Shanbhag. Google Technical Report (2010). https://research.google/pubs/dapper-a-large-scale-distributed-systems-tracing-infrastructure/Source access and scope
Primary record and abstract inspected; linked PDF fetch failed through browsing tool, so no full-text review is claimed.
- X-Trace: A Pervasive Network Tracing Framework
Rodrigo Fonseca, George Porter, Randy H. Katz, Scott Shenker, Ion Stoica. USENIX NSDI (2007). https://www.usenix.org/legacy/events/nsdi07/tech/full_papers/fonseca/fonseca.pdfSource access and scope
Publisher-hosted original PDF metadata, abstract, introduction and explicit limitations on pages 1–2 inspected.
- Pivot Tracing: Dynamic Causal Monitoring for Distributed Systems
Jonathan Mace, Ryan Roelke, Rodrigo Fonseca. ACM SOSP (2015). https://jonathanmace.github.io/papers/mace2015pivot.pdfSource access and scope
Author-hosted original PDF abstract and introduction inspected. Earlier MPI URL returned HTTP 404; active author URL retained.
- Canopy: An End-to-End Performance Tracing And Analysis System
Jonathan Kaldor, Jonathan Mace, Michał Bejda, Edison Gao, Wiktor Kuropatwa, Joe O'Neill, Kian Win Ong, Bill Schaller, Pingjia Shan, Brendan Viscomi, Vinod Venkataraman, Kaushik Veeraraghavan, Yee Jiun Song. ACM SOSP (2017). https://jonathanmace.github.io/papers/kaldor2017canopy.pdf
DOI: 10.1145/3132747.3132749Source access and scope
Author-hosted original PDF title, author list, DOI, abstract and introduction inspected.
- Trace Context
W3C Distributed Tracing Working Group. W3C Recommendation, 23 November 2021 (2021). https://www.w3.org/TR/2021/REC-trace-context-1-20211123/Source access and scope
Official recommendation abstract, header semantics and status inspected; corporate author denotes responsible standards group.
- Sampling
OpenTelemetry Authors. OpenTelemetry Documentation (2025). https://opentelemetry.io/docs/concepts/sampling/Source access and scope
Official head/tail sampling descriptions and operational costs inspected. Page lists last modification 2025-10-16; accessed 2026-10-25.