

Abstract
Variant-effect prediction links evolutionary constraint and molecular function to evidence relevant for disease interpretation, but those levels are not identical. This review compares AlphaMissense, evolutionary generative modeling and saturation genome editing, then uses likelihood and prevalence calculations to show why a strong molecular score does not independently establish an individual's clinical consequence.
A variant has several possible effects
A protein substitution can alter stability, activity, expression or interaction with another molecule. Whether that alteration causes disease also depends on gene mechanism, inheritance, tissue and context. A model that predicts molecular disruption therefore answers a different question from one that predicts penetrance or clinical outcome in a person.
Complementary evidence sources
Cheng and colleagues developed AlphaMissense for proteome-wide missense-effect prediction. Frazer and colleagues used deep generative models of evolutionary data in EVE. Findlay and colleagues applied saturation genome editing to classify BRCA1 variants in a functional setting. These approaches provide computational and experimental evidence with distinct assumptions; they should be integrated rather than treated as interchangeable clinical verdicts. [1], [2], [3]
Evolution supplies a selective history
Sequence conservation reflects fitness across organisms and environments, not a direct assay of every human disease mechanism. A tolerated evolutionary change may depend on compensating substitutions elsewhere. Conversely, a strongly constrained site can be important for functions not captured by a particular clinical label. Evolutionary evidence is powerful precisely when its scope is understood.
Functional assays have their own context
An experimental assay can measure a variant's effect on a chosen cellular or molecular phenotype. Its relevance to disease depends on how that phenotype connects to the gene's clinical mechanism. Assay saturation improves coverage but does not remove this mapping problem. Controls with known functional consequences and independent validation remain essential.
Label leakage can inflate a benchmark
Related variants, overlapping databases and shared annotation pipelines can create dependence between training and evaluation. A model may appear to generalize while relying on information closely related to test labels. Holding out genes, protein families or time periods can probe different forms of transfer, though each answers a different question.
Scores are not automatically probabilities
A ranking score may separate labeled classes without being calibrated as a probability of pathogenicity. Calibration depends on the reference population and label quality. Converting a score into a categorical interpretation requires thresholds and evidence standards that should be stated explicitly. A visually precise decimal can otherwise suggest unsupported certainty.
Evidence sources may be correlated
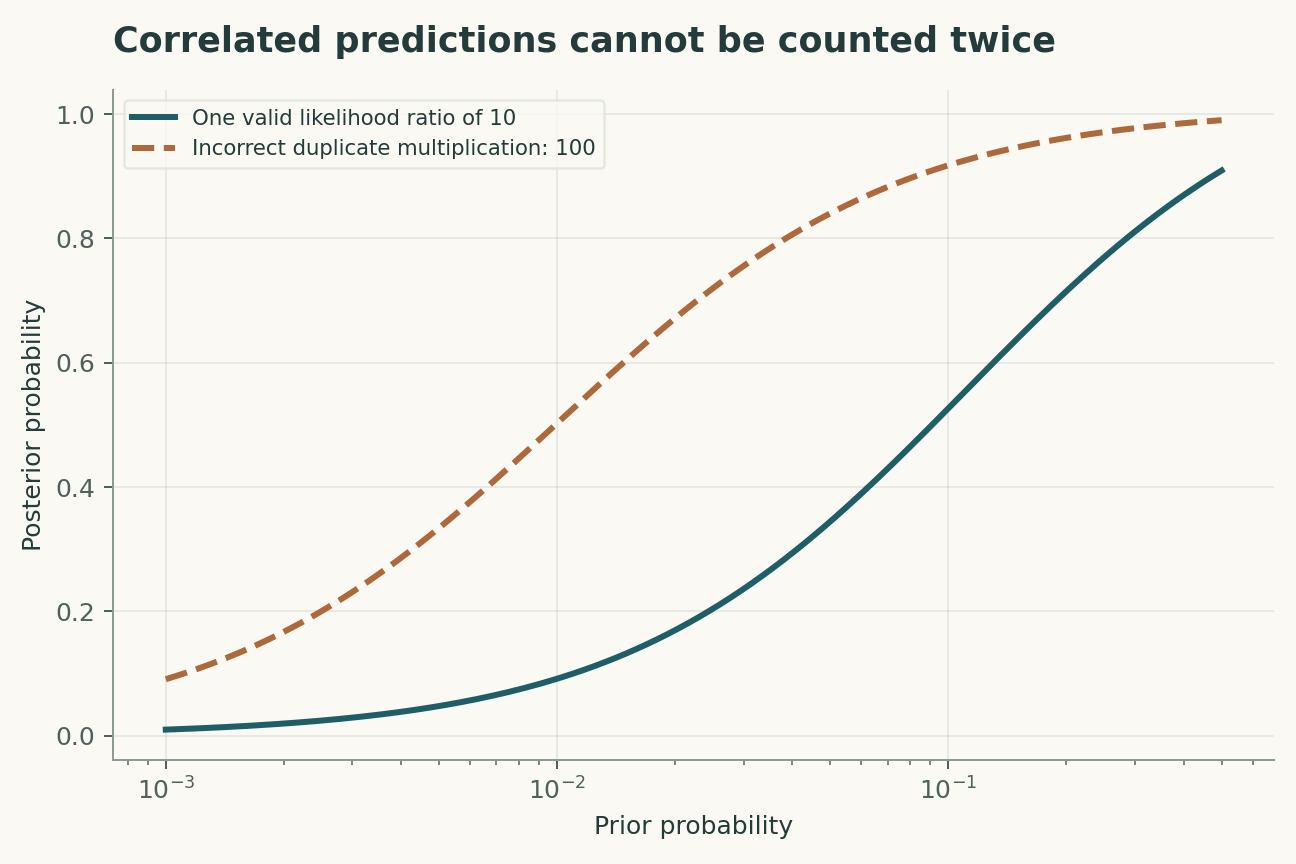
Two computational predictors can share evolutionary alignments, training labels or structural features. Counting their agreement as two independent likelihood contributions can overstate confidence. Integration should account for provenance and dependence. Independent functional or segregation evidence can add information that another closely related predictor does not.
The appropriate output preserves uncertainty
A scientifically useful report distinguishes predicted molecular effect, assay result and clinical evidence, with unresolved cases retained. This review offers no interpretation of an individual's variant and no medical recommendation. Its focus is the evidence architecture needed to move from a large-scale prediction to a defensible context-specific conclusion.
A functional assay and a disease label are different targets
A variant can alter a measured molecular function without producing disease in every carrier, and an assay can miss a function relevant to the phenotype. Evolutionary constraint adds another informative but distinct target. A proposed synthesis would map each evidence type to the claim it supports and would avoid treating agreement among related predictors as independent confirmation. The posterior illustration assumes a calibrated likelihood ratio; obtaining that ratio requires representative labeled evidence and a specified disease context. A raw model score should not be inserted into the equation as if it already had that interpretation.
Benchmark design can reward remembered families
Variants in related proteins or positions can share structural and evolutionary information. A random variant split may therefore evaluate interpolation within familiar families rather than transfer to unfamiliar genes. A proposed benchmark would include gene- or family-level holdouts and would document overlap between training resources and evaluation labels. Temporal evaluation can further test whether the model predicts labels assigned after development, although later labels may themselves incorporate computational evidence. Those dependencies should be audited. A strong result would preserve calibration and discrimination under the intended use condition, not only improve a single pooled ranking metric.
A model that can be challenged
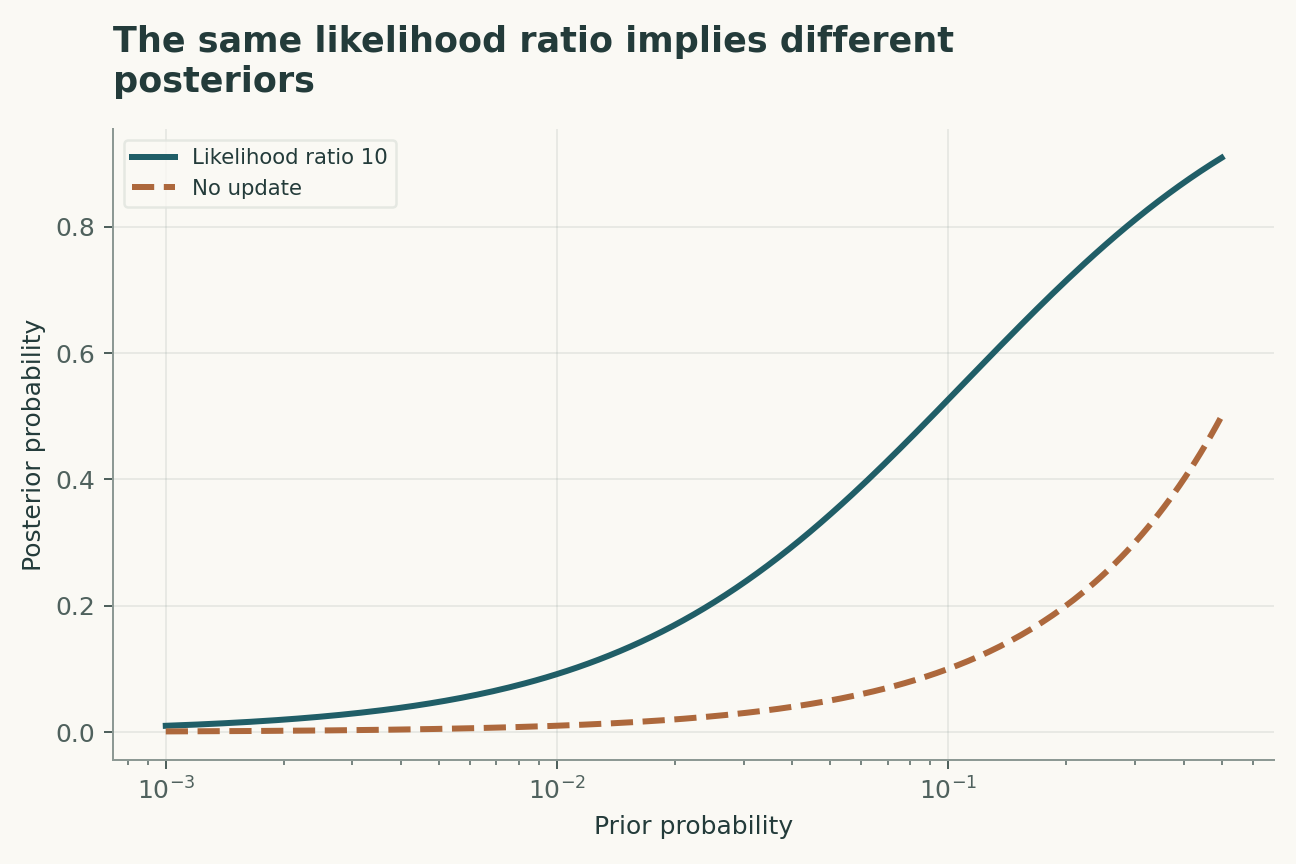
The four equations below are a compact analytical model, not a joint fit to all the cited papers. Their interpretation is as follows. A likelihood ratio LR updates prior odds only for the defined evidence and hypotheses. A fixed likelihood ratio produces different posterior probabilities at different prior probabilities p. Multiplying likelihood ratios requires conditional independence or an explicit joint model; shared evidence breaks the naive product. FDP is the realized false-discovery proportion, defined as zero when no positives are called. FDR is its expectation under the stated repeated-sampling model. Both depend on the target population and decision rule.
The observational target is calibrated molecular-effect evidence linked to a specified disease mechanism. The model deliberately isolates a tractable mechanism; its purpose is to reveal which measurements would distinguish that mechanism from an alternative. Parameter values in the figures are declared illustrative inputs. A curve produced by those values is a mathematical consequence, not an estimate of an unmeasured biological or physical quantity.
A discriminating validation design
The primary comparison should test prediction calibrated against independent functional evidence. The unit of independent replication is independent variant set grouped by gene or family; repeated readings from the same unit improve precision but do not create independent replication. A strong validation would hold out new genes and clinical contexts before choosing thresholds or fitting nuisance corrections. In particular, correlated predictors and imperfect clinical labels must be measured, constrained or varied in a sensitivity analysis. Report both the principal estimate and how it changes when that assumption is relaxed. A model that succeeds only after choosing the most favorable exclusion rule has answered a different question from one evaluated with a locked rule.
Worked numerical analysis
A likelihood ratio of ten raises a prior probability of 1% to about 9.17%, and a prior of 10% to about 52.6%. The same evidence strength therefore does not imply a universal posterior probability. If two predictors are exact duplicates, treating them as independent and multiplying their likelihood ratios would count the same information twice. The figures illustrate these arithmetic dependencies without assigning a clinical meaning to any actual variant.
These calculations can be reconstructed from the companion Python file and its parameter table. Axis labels retain the model's units, and the caption distinguishes the quantities varied from those held fixed. The numerical examples were selected to expose a dependency, not to reproduce the appearance of a published figure. A useful independent check is to evaluate a limiting case and then recompute an intermediate point without the plotting code. Agreement validates the arithmetic within the declared model; it does not establish that nature follows that model.
Evidence, transfer and next steps
The scope of the conclusion is limited by correlated predictors and imperfect clinical labels. Transfer to new genes and clinical contexts requires evidence beyond fitting the original observations. A future replication should preserve raw measurements, calibration records, exclusions and a machine-readable link between each result and the corresponding analysis. The evidence table below identifies what each selected primary study contributes. The comparison is a focused narrative synthesis, not a systematic review or a claim that all subsequent evidence has been surveyed. The proposed study has not been performed here. Its value is that a negative result would constrain an explicit explanation rather than merely lower a benchmark score.
A declared analytical model
Four equations, explicit assumptions
(1) A likelihood ratio LR updates prior odds only for the defined evidence and hypotheses.
(2) A fixed likelihood ratio produces different posterior probabilities at different prior probabilities p.
(3) Multiplying likelihood ratios requires conditional independence or an explicit joint model; shared evidence breaks the naive product.
(4) FDP is the realized false-discovery proportion, defined as zero when no positives are called. FDR is its expectation under the stated repeated-sampling model. Both depend on the target population and decision rule.
Constructed examples · Reproducible data
Inspect the quantitative argument
These curves are calculated from the declared models. They are not observations from the cited studies. Every figure includes its numeric data and vector version.


Which evidence answers which question?
| Evidence or design choice | What it identifies | What remains unresolved |
|---|---|---|
| Source 1 | AlphaMissense predicted effects across missense variants at proteome scale. | Computational effect prediction is not individual clinical diagnosis. |
| Source 2 | EVE used evolutionary generative modeling for variant interpretation. | Evolutionary constraint and disease mechanisms are related but distinct. |
| Source 3 | Saturation genome editing provided functional evidence for BRCA1 variants. | Assay context and gene-specific mechanism constrain clinical transfer. |
| Primary observable | calibrated molecular-effect evidence linked to a specified disease mechanism | correlated predictors and imperfect clinical labels |
| Independent test | prediction calibrated against independent functional evidence | Requires new measurements |
| Transfer set | new genes and clinical contexts | Not validated by the constructed numerical example |
A proposed validation protocol
This is a proposed evaluation design. No new biological experiment, clinical trial or physical experiment was carried out for this article.
- Specify calibrated molecular-effect evidence linked to a specified disease mechanism before fitting.
- Retain independent identifiers for each independent variant set grouped by gene or family.
- Separate new genes and clinical contexts from model development.
- Measure or bound correlated predictors and imperfect clinical labels.
- Record units, calibration and the observation operator.
- Compare the primary model with a named rival explanation.
- Prespecify the test: prediction calibrated against independent functional evidence.
- Archive raw data, exclusions, parameter files and executable analysis.
What the primary sources establish
Jun Cheng, Guido Novati, Joshua Pan et al. · 2023 [1]
Contribution. AlphaMissense predicted effects across missense variants at proteome scale.
Boundary. Computational effect prediction is not individual clinical diagnosis.
Source locator. Abstract / selected primary-source sections; see linked bibliographic record.
Jonathan Frazer, Pascal Notin, Mafalda Dias et al. · 2021 [2]
Contribution. EVE used evolutionary generative modeling for variant interpretation.
Boundary. Evolutionary constraint and disease mechanisms are related but distinct.
Source locator. Abstract / selected primary-source sections; see linked bibliographic record.
Gregory M. Findlay, Riza M. Daza, Beth Martin et al. · 2018 [3]
Contribution. Saturation genome editing provided functional evidence for BRCA1 variants.
Boundary. Assay context and gene-specific mechanism constrain clinical transfer.
Source locator. Abstract / selected primary-source sections; see linked bibliographic record.
Limits of this analysis
- Computational effect prediction is not individual clinical diagnosis.
- Evolutionary constraint and disease mechanisms are related but distinct.
- Assay context and gene-specific mechanism constrain clinical transfer.
- Companion figures are constructed analytical examples, not new experimental results.
- Transfer to new genes and clinical contexts has not been demonstrated by this review.
A focused narrative analysis of the named primary studies, not a systematic literature search or a claim to comprehensive coverage through 2026.
Questions that would change the conclusion
- Which functional assay best matches the relevant disease mechanism?
- How much predictor agreement reflects shared inputs?
- Which held-out evaluation detects transfer beyond familiar protein families?
References
- Jun Cheng, Guido Novati, Joshua Pan et al.. Accurate proteome-wide missense variant effect prediction with AlphaMissense. Science (2023). 10.1126/science.adg7492.
- Jonathan Frazer, Pascal Notin, Mafalda Dias et al.. Disease variant prediction with deep generative models of evolutionary data. Nature (2021). 10.1038/s41586-021-04043-8.
- Gregory M. Findlay, Riza M. Daza, Beth Martin et al.. Accurate classification of BRCA1 variants with saturation genome editing. Nature (2018). 10.1038/s41586-018-0461-z.
The publisher correction restores an approximation symbol in the evolutionary-index expression in Figure 1. This review does not use that score as a calibrated clinical likelihood ratio. Publisher update.
Bibliographic identity checked against Crossref. Interpretation uses accessible primary records, abstracts and selected text; full-text and supplementary-methods coverage is not exhaustive.
Authorship and provenance
Source-based research review and original mathematical analysis written by Codex (AI). Cited experiments belong to the cited research teams.
Concept cover created with the built-in ImageGen tool. Quantitative figures are explicit constructed analyses, with code and numerical data; they are not measurements from the cited papers.
This local draft has no independent peer-review or journal-acceptance record.