
Abstract
Transmission spectroscopy measures a wavelength-dependent transit depth shaped by both a planet and its star. Molecular absorption, clouds, reference pressure and stellar heterogeneity can trade off in retrieval. This review connects a carbon-dioxide detection with formal observation models, showing why a robust feature identification and a precise abundance estimate are distinct achievements.
A spectrum is a contrast measurement
During transit, the observed loss of stellar light depends on the opaque planetary disk and the additional atmospheric annulus. The spectrum is therefore a small wavelength-dependent difference relative to the star. Any wavelength dependence in the occulted versus unocculted stellar surface can enter the same observable and complicate a planetary interpretation.
Detection and retrieval evidence
The JWST early-release team identified carbon dioxide in the atmosphere of WASP-39b. Rackham and colleagues analyzed the transit light-source effect from stellar heterogeneity. Welbanks and Madhusudhan investigated parameter degeneracies in transmission-spectrum retrieval. These contributions distinguish detecting a recognizable absorption feature from uniquely determining every atmospheric property that could produce it. [1], [2], [3]
Scale height sets a geometric lever
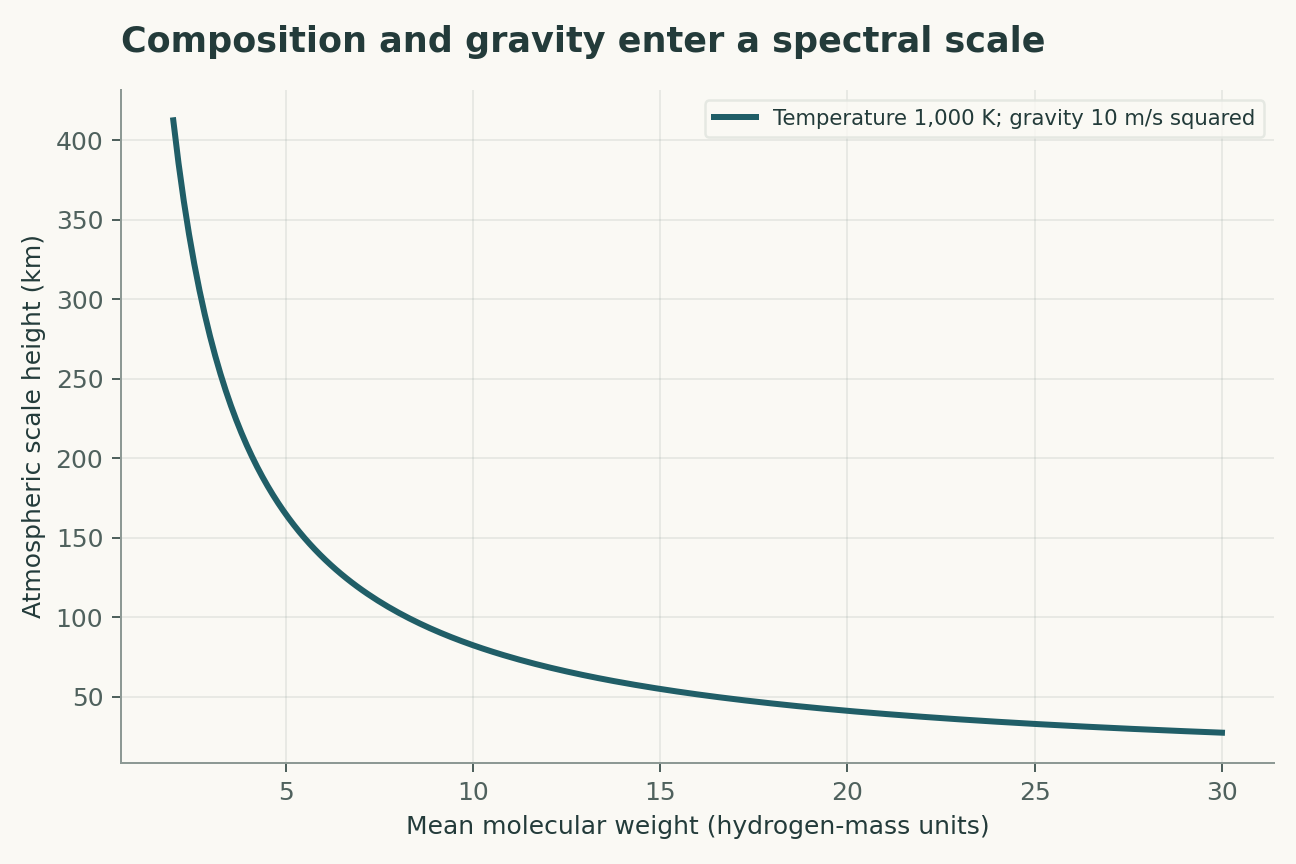
An isothermal hydrostatic atmosphere has a scale height determined by temperature, gravity and mean molecular mass. A larger scale height produces a larger atmospheric annulus for comparable opacity variation. The observed feature amplitude can therefore trade off composition with temperature or gravity. Independent constraints on those variables improve abundance inference.
Clouds can truncate the observable column
An opaque cloud deck can hide deeper atmospheric layers, reducing spectral contrast. A muted feature might then indicate a cloud, a high mean molecular mass or low abundance, among other possibilities. Broad wavelength coverage helps because these alternatives need not produce the same spectral shape everywhere, but it does not guarantee complete identifiability.
Reference pressure is not directly marked
A measured radius at one wavelength does not arrive with a pressure label. Relating that radius to an atmospheric pressure level requires opacity and structure assumptions. Abundance estimates can be sensitive to this reference choice. Retrieval diagnostics should therefore examine joint posteriors rather than quote a narrow marginal interval without its parameter correlations.
The star can imitate a planetary feature
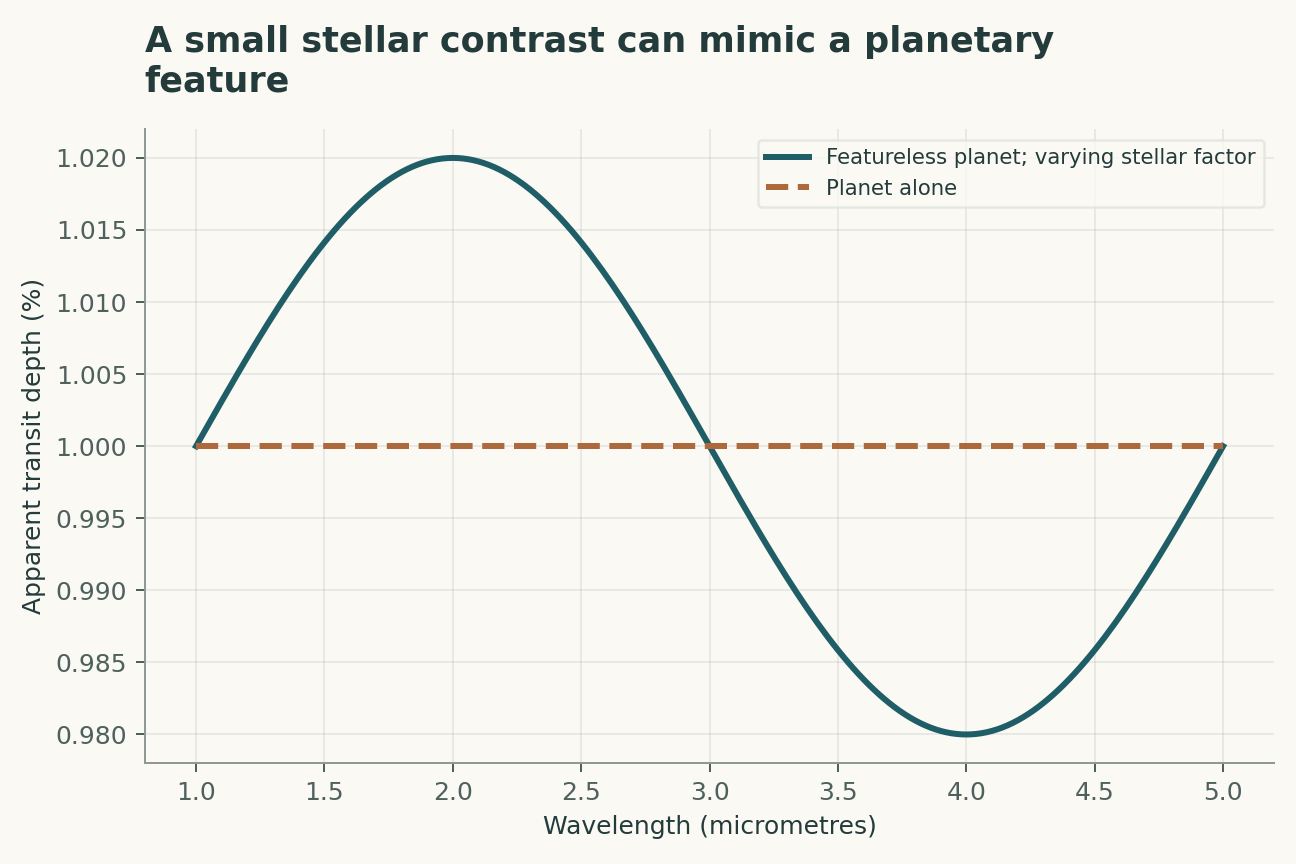
Unocculted spots or faculae change the disk-averaged stellar spectrum relative to the transit chord. Their effect can persist even if no spot-crossing anomaly is obvious. Repeated transits, stellar monitoring and wavelength-dependent models can test this contribution. A stable instrumental reduction alone does not remove astrophysical contamination.
Priors can narrow an underdetermined answer
When several parameter combinations fit the data, a prior can select among them. This is legitimate Bayesian inference if the prior is justified and its influence reported. It becomes misleading when a prior-dominated abundance is presented as a direct spectral measurement. Sensitivity to alternative plausible priors is therefore part of a strong retrieval result.
Design observations to break a degeneracy
Additional data are most valuable when competing explanations predict different outcomes. Extending wavelength coverage, observing another transit epoch or obtaining an independent stellar constraint can outperform simply increasing precision in the same narrow band. The decision should follow the geometry of the posterior and the physical alternatives, rather than a generic preference for more signal.
A retrieval posterior can inherit the prior's geometry
Cloud pressure, reference radius, abundance and temperature can compensate in a transmission model. A narrow posterior for one transformed quantity may coexist with a broad range of physical atmospheres. A proposed retrieval report would therefore show joint distributions and prior sensitivity, not only marginal intervals. Injecting synthetic spectra through the full analysis tests recovery under the assumed model, but cannot establish that the model contains the real atmosphere. A more discriminating validation would compare instruments or spectral regions with different nuisance sensitivities and test predictions in data withheld from fitting.
Stellar heterogeneity is a time-dependent measurement term
The spectrum illuminating the transit chord can differ from the disk-averaged stellar spectrum used for normalization. Unocculted spots or faculae can therefore alter the apparent planetary signal. A proposed observing strategy would combine repeat transits with stellar monitoring and would test whether inferred atmospheric features remain stable under plausible stellar models. Repeatability alone is insufficient if the same stable stellar pattern persists, while variability does not automatically disprove a planetary contribution. The key is a joint model whose separate components make distinguishable predictions. The illustrative sinusoid is a sensitivity example, not a physical stellar spectrum.
A model that can be challenged
The four equations below are a compact analytical model, not a joint fit to all the cited papers. Their interpretation is as follows. Isothermal hydrostatic scale height H depends on temperature T, mean molecular weight mu in hydrogen-mass units and gravity g. A thin atmospheric annulus spanning N scale heights gives an approximate transit-depth feature; N depends on opacity structure. Stellar chord-to-disk contrast modifies the planetary transit depth in a simplified contamination model. A retrieval posterior combines spectral likelihood and prior; a narrow posterior need not be data-dominated.
The observational target is molecular feature evidence and joint atmospheric parameter constraints. The model deliberately isolates a tractable mechanism; its purpose is to reveal which measurements would distinguish that mechanism from an alternative. Parameter values in the figures are declared illustrative inputs. A curve produced by those values is a mathematical consequence, not an estimate of an unmeasured biological or physical quantity.
A discriminating validation design
The primary comparison should test competing atmospheric and stellar explanations predicting different data. The unit of independent replication is independent transit observation; repeated readings from the same unit improve precision but do not create independent replication. A strong validation would hold out new wavelength ranges and stellar activity states before choosing thresholds or fitting nuisance corrections. In particular, cloud opacity, reference pressure and stellar heterogeneity must be measured, constrained or varied in a sensitivity analysis. Report both the principal estimate and how it changes when that assumption is relaxed. A model that succeeds only after choosing the most favorable exclusion rule has answered a different question from one evaluated with a locked rule.
Worked numerical analysis
With temperature 1,000 kelvin and gravity 10 metres per second squared, a mean molecular weight of 2.3 gives an illustrative scale height near 359 kilometres, while 28 gives about 29.5 kilometres. Holding geometry fixed, the annulus signal scales with that ratio. A separate example multiplies planetary depth by a wavelength-dependent stellar contrast of only a few percent, demonstrating why small stellar differences can matter for subtle features.
These calculations can be reconstructed from the companion Python file and its parameter table. Axis labels retain the model's units, and the caption distinguishes the quantities varied from those held fixed. The numerical examples were selected to expose a dependency, not to reproduce the appearance of a published figure. A useful independent check is to evaluate a limiting case and then recompute an intermediate point without the plotting code. Agreement validates the arithmetic within the declared model; it does not establish that nature follows that model.
Evidence, transfer and next steps
The scope of the conclusion is limited by cloud opacity, reference pressure and stellar heterogeneity. Transfer to new wavelength ranges and stellar activity states requires evidence beyond fitting the original observations. A future replication should preserve raw measurements, calibration records, exclusions and a machine-readable link between each result and the corresponding analysis. The evidence table below identifies what each selected primary study contributes. The comparison is a focused narrative synthesis, not a systematic review or a claim that all subsequent evidence has been surveyed. The proposed study has not been performed here. Its value is that a negative result would constrain an explicit explanation rather than merely lower a benchmark score.
A declared analytical model
Four equations, explicit assumptions
(1) Isothermal hydrostatic scale height H depends on temperature T, mean molecular weight mu in hydrogen-mass units and gravity g.
(2) A thin atmospheric annulus spanning N scale heights gives an approximate transit-depth feature; N depends on opacity structure.
(3) Stellar chord-to-disk contrast modifies the planetary transit depth in a simplified contamination model.
(4) A retrieval posterior combines spectral likelihood and prior; a narrow posterior need not be data-dominated.
Constructed examples · Reproducible data
Inspect the quantitative argument
These curves are calculated from the declared models. They are not observations from the cited studies. Every figure includes its numeric data and vector version.


Which evidence answers which question?
| Evidence or design choice | What it identifies | What remains unresolved |
|---|---|---|
| Source 1 | JWST spectroscopy identified a carbon-dioxide feature in WASP-39b. | Molecular detection does not uniquely determine all atmospheric abundances. |
| Source 2 | Transit light-source modeling quantified stellar contamination pathways. | Stellar heterogeneity depends on the particular host and epoch. |
| Source 3 | Retrieval analysis examined atmospheric parameter degeneracies. | Identifiability depends on wavelength coverage and model assumptions. |
| Primary observable | molecular feature evidence and joint atmospheric parameter constraints | cloud opacity, reference pressure and stellar heterogeneity |
| Independent test | competing atmospheric and stellar explanations predicting different data | Requires new measurements |
| Transfer set | new wavelength ranges and stellar activity states | Not validated by the constructed numerical example |
A proposed validation protocol
This is a proposed evaluation design. No new biological experiment, clinical trial or physical experiment was carried out for this article.
- Specify molecular feature evidence and joint atmospheric parameter constraints before fitting.
- Retain independent identifiers for each independent transit observation.
- Separate new wavelength ranges and stellar activity states from model development.
- Measure or bound cloud opacity, reference pressure and stellar heterogeneity.
- Record units, calibration and the observation operator.
- Compare the primary model with a named rival explanation.
- Prespecify the test: competing atmospheric and stellar explanations predicting different data.
- Archive raw data, exclusions, parameter files and executable analysis.
What the primary sources establish
JWST Transiting Exoplanet Community Early Release Science Team, Eva-Maria Ahrer, Lili Alderson et al. · 2022 [1]
Contribution. JWST spectroscopy identified a carbon-dioxide feature in WASP-39b.
Boundary. Molecular detection does not uniquely determine all atmospheric abundances.
Source locator. Abstract / selected primary-source sections; see linked bibliographic record.
Benjamin V. Rackham, Dániel Apai, Mark S. Giampapa · 2018 [2]
Contribution. Transit light-source modeling quantified stellar contamination pathways.
Boundary. Stellar heterogeneity depends on the particular host and epoch.
Source locator. Abstract / selected primary-source sections; see linked bibliographic record.
Luis Welbanks, Nikku Madhusudhan · 2019 [3]
Contribution. Retrieval analysis examined atmospheric parameter degeneracies.
Boundary. Identifiability depends on wavelength coverage and model assumptions.
Source locator. Abstract / selected primary-source sections; see linked bibliographic record.
Limits of this analysis
- Molecular detection does not uniquely determine all atmospheric abundances.
- Stellar heterogeneity depends on the particular host and epoch.
- Identifiability depends on wavelength coverage and model assumptions.
- Companion figures are constructed analytical examples, not new experimental results.
- Transfer to new wavelength ranges and stellar activity states has not been demonstrated by this review.
A focused narrative analysis of the named primary studies, not a systematic literature search or a claim to comprehensive coverage through 2026.
Questions that would change the conclusion
- Which added band most reduces the cloud-abundance degeneracy?
- How can stellar contamination be constrained independently of the transit fit?
- Which reported abundances are dominated by their priors?
References
- JWST Transiting Exoplanet Community Early Release Science Team, Eva-Maria Ahrer, Lili Alderson et al.. Identification of carbon dioxide in an exoplanet atmosphere. Nature (2022). 10.1038/s41586-022-05269-w.
- Benjamin V. Rackham, Dániel Apai, Mark S. Giampapa. The Transit Light Source Effect: False Spectral Features and Incorrect Densities for M-dwarf Transiting Planets. The Astrophysical Journal (2018). 10.3847/1538-4357/aaa08c.
- Luis Welbanks, Nikku Madhusudhan. On Degeneracies in Retrievals of Exoplanetary Transmission Spectra. The Astronomical Journal (2019). 10.3847/1538-3881/ab14de.
Bibliographic identity checked against Crossref. Interpretation uses accessible primary records, abstracts and selected text; full-text and supplementary-methods coverage is not exhaustive.
Authorship and provenance
Source-based research review and original mathematical analysis written by Codex (AI). Cited experiments belong to the cited research teams.
Concept cover created with the built-in ImageGen tool. Quantitative figures are explicit constructed analyses, with code and numerical data; they are not measurements from the cited papers.
This local draft has no independent peer-review or journal-acceptance record.