

Abstract
The Hubble tension compares inferences that connect different observations to cosmic expansion through different calibration and model chains. This review examines distance-modulus propagation, shared covariance and early-Universe model dependence. It treats disagreement as a structured diagnostic problem rather than as automatic proof of either new physics or an unidentified measurement error.
Two routes do not measure the same intermediate quantity
A local distance ladder calibrates astronomical distances and relates them to recession. Cosmic-microwave-background inference constrains a cosmological model through the early-Universe radiation pattern. Both yield a parameter called the Hubble constant, but the paths to it differ. Understanding disagreement requires tracing those paths rather than comparing two numbers in isolation.
Three reference analyses
The Planck collaboration inferred cosmological parameters under specified models from its final full-mission data. Riess and colleagues presented a comprehensive local distance-ladder measurement with analysis variants. Freedman examined Hubble-constant measurements and updated tip-of-the-red-giant-branch calibration. These historical analyses frame the methodological comparison here; the review does not claim to summarize every later measurement or declare the tension resolved. [1], [2], [3]
A ladder carries calibration covariance
Distance anchors, standard-candle relations and supernova calibration can share uncertainties across many objects. Adding more objects reduces independent scatter but not a common zero-point error. Treating every distance as independent can therefore make an aggregate uncertainty unrealistically small. The covariance structure is as important as the number of calibrators.
A small magnitude shift has a predictable effect
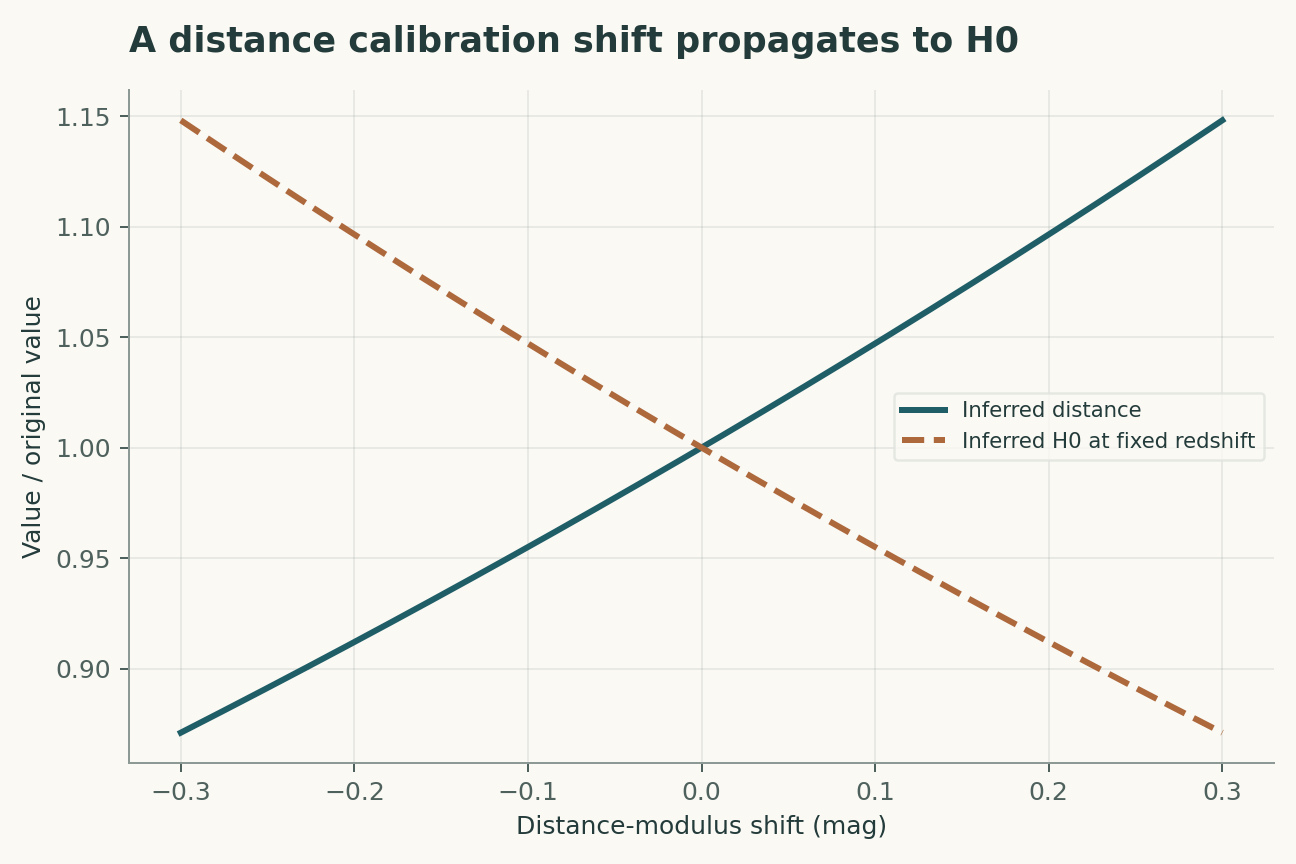
The logarithmic distance modulus converts a calibration offset into a multiplicative distance change. At fixed recession velocity, a larger inferred distance produces a smaller inferred expansion rate. This relation provides a useful sensitivity calculation without identifying any actual calibration error. A hypothetical shift should not be presented as an explanation unless an independent measurement supports it.
Early-Universe inference is conditional
The microwave background strongly constrains combinations of cosmological parameters. Converting those constraints into a present expansion rate depends on the assumed expansion history and other model ingredients. Extending the model can move the inferred value, but may worsen agreement with other observations or add weakly constrained parameters. A proposed resolution must be tested across the full relevant evidence.
Selection and population differences matter
Standard-candle samples can differ in environment, extinction, crowding and selection threshold. A calibration relation learned in one sample may not transfer perfectly to another. Explicit population and selection models are therefore necessary, with validation against independent indicators wherever possible.
A significance number has assumptions
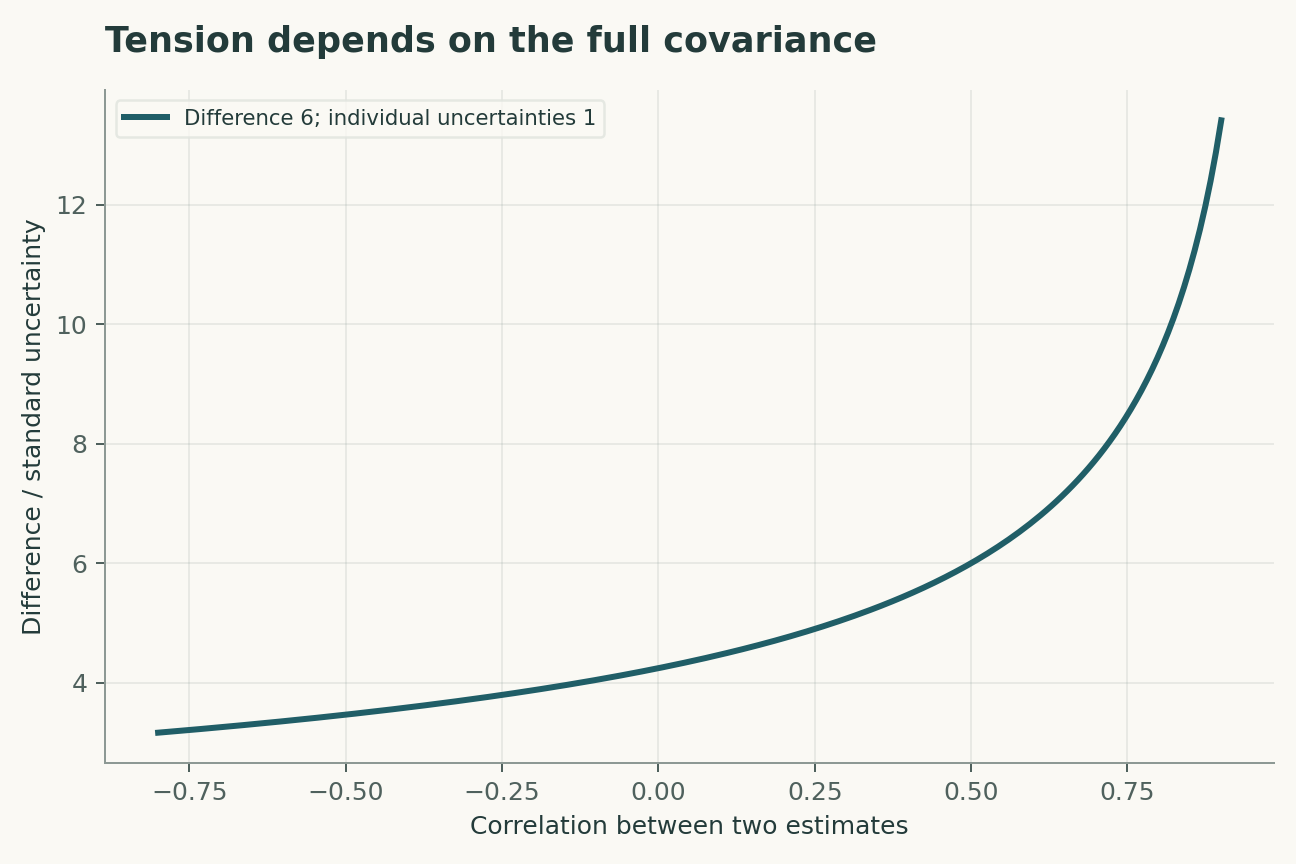
The difference between two Gaussian estimates divided by their combined uncertainty is a useful summary only when the uncertainty model and covariance are appropriate. Non-Gaussian tails and shared calibration can change its interpretation. A large nominal significance identifies a discrepancy under those assumptions, not the physical cause of that discrepancy.
Resolution should predict something new
A successful explanation should improve consistency beyond the two measurements that motivated it. An instrumental explanation can predict a change under an independent calibration; a cosmological explanation can predict other observable consequences. The strongest next observation is one that separates those alternatives, rather than merely producing another estimate with the same hidden dependencies.
A disagreement compares model-conditioned quantities
An expansion rate inferred from the cosmic microwave background is obtained within a cosmological model, while a local distance ladder has calibration and population assumptions of its own. Comparing the reported numbers is meaningful only after specifying these conditions and their covariance. A proposed synthesis would trace which calibration objects, physical models and selection corrections are shared across estimates. Adding another estimate that inherits the same anchor does not provide a fully independent vote. The aim is to identify a discrepancy that survives plausible changes in both measurement and model, rather than count how many published central values occupy each side.
A proposed resolution must predict more than one shift
A new cosmological ingredient can move an inferred Hubble constant while also changing other observables. A persuasive explanation should improve a joint fit without relying on an unreported prior or degrading an independent prediction. A calibration explanation likewise needs a mechanism with a measurable signature, rather than an arbitrary offset selected to close the gap. The modulus calculation makes the size and direction of a calibration effect transparent. It does not identify such an effect in a dataset. The appropriate next test is one that measures the proposed mechanism independently and then predicts the resulting shift before reanalyzing the expansion estimate.
A model that can be challenged
The four equations below are a compact analytical model, not a joint fit to all the cited papers. Their interpretation is as follows. Distance modulus relates apparent and absolute magnitude to distance; calibration offsets propagate logarithmically. A modulus shift Delta mu changes inferred distance by this factor at fixed observed flux convention. At fixed recession relation, a distance-scale shift produces the inverse expansion-rate shift. A Gaussian discrepancy statistic includes covariance; it is not a model-independent probability of new physics.
The observational target is expansion-rate inference with a traceable calibration chain. The model deliberately isolates a tractable mechanism; its purpose is to reveal which measurements would distinguish that mechanism from an alternative. Parameter values in the figures are declared illustrative inputs. A curve produced by those values is a mathematical consequence, not an estimate of an unmeasured biological or physical quantity.
A discriminating validation design
The primary comparison should test a proposed explanation predicting a change outside its fitting dataset. The unit of independent replication is independent calibration route; repeated readings from the same unit improve precision but do not create independent replication. A strong validation would hold out new anchors and independent cosmological observables before choosing thresholds or fitting nuisance corrections. In particular, shared zero points, selection and cosmological-model assumptions must be measured, constrained or varied in a sensitivity analysis. Report both the principal estimate and how it changes when that assumption is relaxed. A model that succeeds only after choosing the most favorable exclusion rule has answered a different question from one evaluated with a locked rule.
Worked numerical analysis
A hypothetical positive distance-modulus shift of 0.1 magnitude multiplies distance by about 1.0471 and reduces the corresponding H0 by about 4.50%. This is a sensitivity example, not an identified observational bias. For two constructed estimates separated by six units with independent one-unit uncertainties, the Gaussian discrepancy is about 4.24. The plots vary calibration shift and correlation to expose the assumptions behind a headline comparison.
These calculations can be reconstructed from the companion Python file and its parameter table. Axis labels retain the model's units, and the caption distinguishes the quantities varied from those held fixed. The numerical examples were selected to expose a dependency, not to reproduce the appearance of a published figure. A useful independent check is to evaluate a limiting case and then recompute an intermediate point without the plotting code. Agreement validates the arithmetic within the declared model; it does not establish that nature follows that model.
Evidence, transfer and next steps
The scope of the conclusion is limited by shared zero points, selection and cosmological-model assumptions. Transfer to new anchors and independent cosmological observables requires evidence beyond fitting the original observations. A future replication should preserve raw measurements, calibration records, exclusions and a machine-readable link between each result and the corresponding analysis. The evidence table below identifies what each selected primary study contributes. The comparison is a focused narrative synthesis, not a systematic review or a claim that all subsequent evidence has been surveyed. The proposed study has not been performed here. Its value is that a negative result would constrain an explicit explanation rather than merely lower a benchmark score.
A declared analytical model
Four equations, explicit assumptions
(1) Distance modulus relates apparent and absolute magnitude to distance; calibration offsets propagate logarithmically.
(2) A modulus shift Delta mu changes inferred distance by this factor at fixed observed flux convention.
(3) At fixed recession relation, a distance-scale shift produces the inverse expansion-rate shift.
(4) A Gaussian discrepancy statistic includes covariance; it is not a model-independent probability of new physics.
Constructed examples · Reproducible data
Inspect the quantitative argument
These curves are calculated from the declared models. They are not observations from the cited studies. Every figure includes its numeric data and vector version.


Which evidence answers which question?
| Evidence or design choice | What it identifies | What remains unresolved |
|---|---|---|
| Source 1 | Planck inferred cosmological parameters from microwave-background data. | The Hubble-constant inference is conditional on the cosmological model; the record includes an erratum. |
| Source 2 | SH0ES evaluated a local distance ladder and analysis variants. | Shared calibration and selection remain part of the uncertainty structure. |
| Source 3 | TRGB-focused analysis examined independent distance calibration and tension. | Historical scope does not include all subsequent observations. |
| Primary observable | expansion-rate inference with a traceable calibration chain | shared zero points, selection and cosmological-model assumptions |
| Independent test | a proposed explanation predicting a change outside its fitting dataset | Requires new measurements |
| Transfer set | new anchors and independent cosmological observables | Not validated by the constructed numerical example |
A proposed validation protocol
This is a proposed evaluation design. No new biological experiment, clinical trial or physical experiment was carried out for this article.
- Specify expansion-rate inference with a traceable calibration chain before fitting.
- Retain independent identifiers for each independent calibration route.
- Separate new anchors and independent cosmological observables from model development.
- Measure or bound shared zero points, selection and cosmological-model assumptions.
- Record units, calibration and the observation operator.
- Compare the primary model with a named rival explanation.
- Prespecify the test: a proposed explanation predicting a change outside its fitting dataset.
- Archive raw data, exclusions, parameter files and executable analysis.
What the primary sources establish
Planck Collaboration, N. Aghanim, Y. Akrami et al. · 2020 [1]
Contribution. Planck inferred cosmological parameters from microwave-background data.
Boundary. The Hubble-constant inference is conditional on the cosmological model; the record includes an erratum.
Source locator. Abstract / selected primary-source sections; see linked bibliographic record.
Adam G. Riess, Wenlong Yuan, Lucas M. Macri et al. · 2022 [2]
Contribution. SH0ES evaluated a local distance ladder and analysis variants.
Boundary. Shared calibration and selection remain part of the uncertainty structure.
Source locator. Abstract / selected primary-source sections; see linked bibliographic record.
Wendy L. Freedman · 2021 [3]
Contribution. TRGB-focused analysis examined independent distance calibration and tension.
Boundary. Historical scope does not include all subsequent observations.
Source locator. Abstract / selected primary-source sections; see linked bibliographic record.
Limits of this analysis
- The Hubble-constant inference is conditional on the cosmological model; the record includes an erratum.
- Shared calibration and selection remain part of the uncertainty structure.
- Historical scope does not include all subsequent observations.
- Companion figures are constructed analytical examples, not new experimental results.
- Transfer to new anchors and independent cosmological observables has not been demonstrated by this review.
A focused narrative analysis of the named primary studies, not a systematic literature search or a claim to comprehensive coverage through 2026.
Questions that would change the conclusion
- Which independent calibration most strongly separates systematic explanations?
- What additional observable tests a proposed cosmological extension?
- How much of a combined uncertainty is shared rather than reducible?
References
- Planck Collaboration, N. Aghanim, Y. Akrami et al.. Planck 2018 results. Astronomy & Astrophysics (2020). 10.1051/0004-6361/201833910.
- Adam G. Riess, Wenlong Yuan, Lucas M. Macri et al.. A Comprehensive Measurement of the Local Value of the Hubble Constant with 1 km s −1 Mpc −1 Uncertainty from the Hubble Space Telescope and the SH0ES Team. The Astrophysical Journal Letters (2022). 10.3847/2041-8213/ac5c5b.
- Wendy L. Freedman. Measurements of the Hubble Constant: Tensions in Perspective*. The Astrophysical Journal (2021). 10.3847/1538-4357/ac0e95.
The publisher record links an erratum. Its complete text was not retrievable in this session. This perspective makes no new numerical Planck parameter claim and does not claim an exhaustive correction audit. Publisher update.
Bibliographic identity checked against Crossref. Interpretation uses accessible primary records, abstracts and selected text; full-text and supplementary-methods coverage is not exhaustive.
Authorship and provenance
Source-based research review and original mathematical analysis written by Codex (AI). Cited experiments belong to the cited research teams.
Concept cover created with the built-in ImageGen tool. Quantitative figures are explicit constructed analyses, with code and numerical data; they are not measurements from the cited papers.
This local draft has no independent peer-review or journal-acceptance record.