
Abstract
Deep learning has been used for seismic waveform detection and phase-arrival picking, but the ultimate observational product is a catalogue containing event identities, times, locations, and uncertainties. This article compares EQTransformer, PhaseNet, and an adaptation for distributed fibre-optic sensing, separating single-station outputs, cross-station association, and catalogue completeness into distinct levels. Through simplified travel-time relationships and a detection-threshold model, we derive how arrival-time errors affect distance and explain how changes in observation thresholds can increase event counts without implying an increase in seismic activity itself. The figures contain no actual earthquake cases or early-warning data and provide no earthquake predictions.[1] Earthquake transformer—an attentive deep-learning model[2] PhaseNet: a deep-neural-network-based seismic arrival-t[3] Seismic arrival-time picking on distributed acoustic se
English abstract
Seismic machine learning can improve detection and phase picking, but a scientifically useful catalogue also requires association, location and completeness analysis. We compare EQTransformer, PhaseNet and a DAS adaptation. A travel-time derivation converts picking uncertainty into distance uncertainty; a detection-threshold construction shows how catalogue completeness changes apparent event counts and magnitude trends. All waveforms and catalogue curves are synthetic analytical examples, not earthquake forecasts or warning products.
1. Detection and picking share waveforms but have different endpoints
EQTransformer jointly handles event detection and P- and S-phase picking, while PhaseNet maps three-component waveforms to phase- and noise-related outputs. Detection primarily concerns signal presence, whereas picking also concerns arrival-time accuracy. High detection recall does not establish sufficiently accurate arrival times, and narrow, accurate picks may still miss low-signal-to-noise events. This article recommends separately reporting false event detections in continuous noise, phase recall for known events, and arrival-time residual distributions, retaining long tails and station differences rather than representing the entire observation chain with a single F-score.[1] Earthquake transformer—an attentive deep-learning model[2] PhaseNet: a deep-neural-network-based seismic arrival-t
2. Input windows and preprocessing define the task the model sees
Sampling rate, component order, filtering, normalization, and window position all affect waveform representation. PhaseNet training and application use explicit waveform and label settings; transferring the model to different instruments or sampling schemes requires rechecking units and responses. This article proposes changing the window start for the same continuous signal to test pick stability and recording failures at window edges separately. Tests that always place phases at the centre of the window may underestimate the difficulty of actual continuous processing. Processing speed should also include preprocessing, overlapping windows, and deduplication, rather than recording only the forward-pass time for a single batch.[2] PhaseNet: a deep-neural-network-based seismic arrival-t[1] Earthquake transformer—an attentive deep-learning model
3. Derivation in this article: the P-S time difference corresponds to distance only under an assumed medium
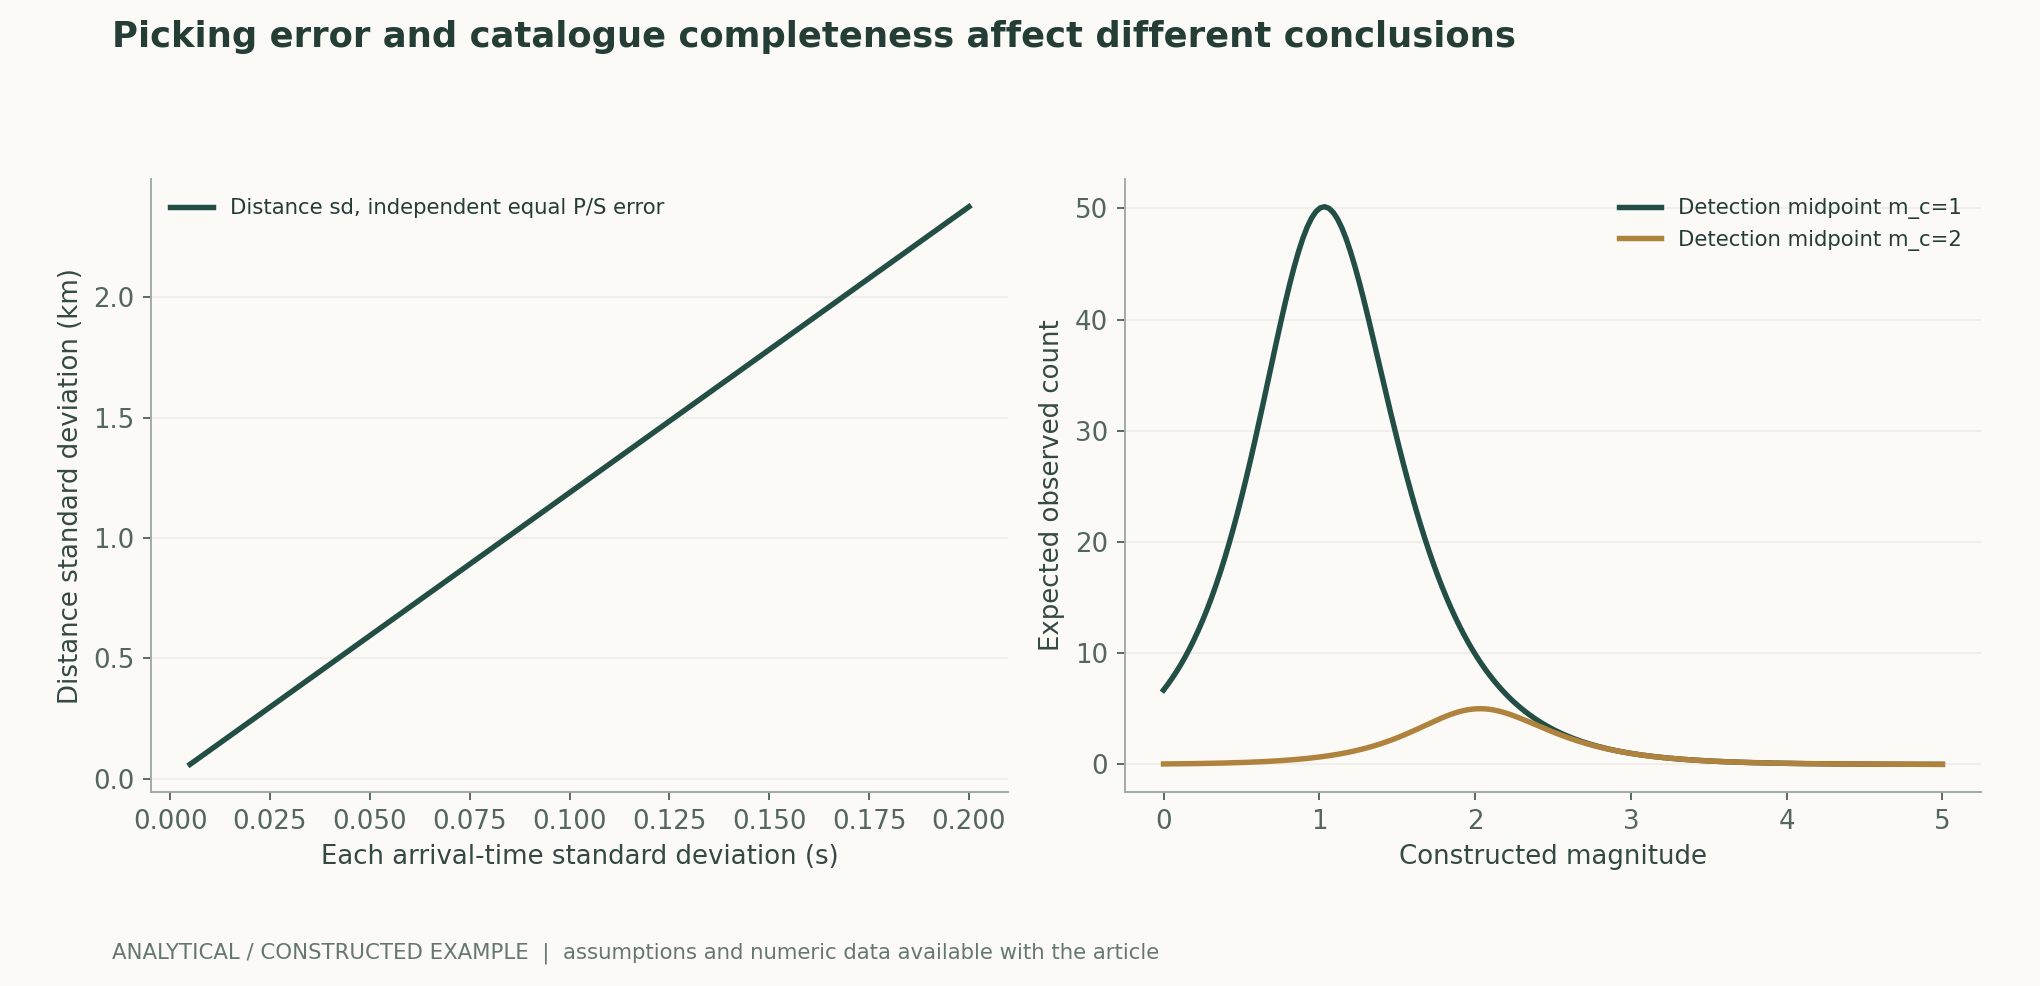
Under a homogeneous-medium and same-path approximation, the P-S arrival-time difference equals distance multiplied by the difference between the reciprocals of the two wave speeds. Assuming vP=6 and vS=3.5 km/s, each second of difference corresponds to approximately 8.4 km; if the independent arrival-time standard deviation of each phase is 0.05 seconds, the distance standard deviation is approximately 0.594 km. The figure explores sensitivity to arrival-time errors and also shows how misspecified wave speeds produce systematic bias. This example is not an actual location model: layering, paths, source depth, and station geometry can all change the relationship, and a single-station distance cannot directly be called an epicentral location.作者分析与复核建议 / Author analysis
4. Peaks in phase-probability curves do not represent full location uncertainty
Networks typically output time-varying scores or probability profiles, whose peaks help generate candidate arrival times. However, training-label shape, window width, and normalization affect the meaning of a peak; it need not equal the probability of event presence or the true arrival-time posterior. This article recommends calibrating presence, arrival time, and match quality separately, then propagating uncertainty through association and location. If the waveforms of two nearby events overlap, forcing selection of only the highest peak may discard genuine multi-event structure; such failures should be retained rather than excluded from single-event tests.[1] Earthquake transformer—an attentive deep-learning model[2] PhaseNet: a deep-neural-network-based seismic arrival-t
5. Cross-station association determines how picks become events
Constructing events from candidate arrivals at many stations requires determining which picks belong to the same source. An overly broad association window can merge events, while an overly narrow one can split or miss them. This article recommends evaluating association using an independent catalogue with true event identities or manual spot checks, separately counting duplicate events, erroneous merges, and invalid locations. If most new detections come from single-station noise, improved single-station recall will not automatically produce a more complete, trustworthy catalogue. Low location residuals cannot entirely rule out incorrect association either, because an incorrect velocity model and incorrect pick combinations may compensate for each other.作者分析与复核建议 / Author analysis
6. Distributed fibre-optic observation requires remodelling spatial structure
PhaseNet-DAS targets distributed fibre-optic acoustic data and adapts through semi-supervised learning and spatiotemporal information, showing that a change in instrument domain is not simply an adjustment of input length. Fibre-optic measurements differ from conventional three-component stations in their measured quantities, directionality, and spatial sampling. This article recommends retaining channel geometry, effective length, orientation, and data quality, and holding out entire fibre segments or regions. Many adjacent channels are highly correlated; treating every channel as an independent station would artificially create an enormous statistical sample size.[3] Seismic arrival-time picking on distributed acoustic se
7. Derivation in this article: changing detection thresholds reshapes catalogue counts
We construct a latent event count that decreases with magnitude as 10 raised to the power of minus b times magnitude, while detection probability rises smoothly with magnitude. Observed counts equal their product, so the curve at small magnitudes is influenced by both the true distribution and detection efficiency. Lowering the detection midpoint increases event counts, especially near the original threshold; this does not imply an increase in the true occurrence rate. The figure plots two thresholds using the same latent distribution, and all parameters are constructed values. Comparisons of catalogues before and after upgrades should first correct for observational completeness and changes in coverage.作者分析与复核建议 / Author analysis
8. External testing should include continuous noise and held-out regions
The original EQTransformer paper examined additional detections and locations in continuous Tottori data; the specific gains apply to that network and time interval. This article proposes validation across different regions, instruments, seasonal noise conditions, and long continuous periods, particularly retaining intervals without earthquakes. Testing only on cropped event windows cannot estimate the real everyday false-alarm burden. Catalogue comparisons should also standardize station count, operating duration, downtime, and quality screening; gains from more sensors or longer records cannot all be attributed to the model.[1] Earthquake transformer—an attentive deep-learning model
9. Statistical evaluation must return to the event and network levels
Arrival-time residuals can be reported per pick, but event recall, location, and completeness require event-level evaluation; long-term stability also involves date and network levels. This article recommends paired comparisons over continuous time blocks, with results broken down by event size, distance, and signal-to-noise ratio. Human labels may also contain picking preferences and omissions, so external catalogues should be treated as fallible references rather than absolutely complete ground truth. Newly detected events without independent confirmation should retain candidate status; greater model sensitivity does not justify directly including every new object in scientific conclusions.作者分析与复核建议 / Author analysis
Technical supplement A · Probability-label shape is not event probability
Training a segmenter with a smooth kernel around a seismic phase makes its output depend on both presence and arrival-time label width. For the same true arrival time, a wider training kernel also changes the peak profile and maximum value. This article recommends fixing label definitions and using independent continuous data to calibrate detection and timing error separately; a peak value of 0.9 cannot directly be interpreted as a 90% earthquake probability. For multimodal outputs, peak candidates and association results should be retained rather than deleting structure to obtain a single value.作者分析与复核建议 / Author analysis
Technical supplement B · Wave-speed misspecification and picking error may be confounded
In the simplified P-S expression, the distance coefficient is jointly determined by the two wave speeds. Systematically low or high wave speeds cause distance bias even with error-free arrival times; conversely, adjusting wave speeds using data with known locations may partly absorb picking bias. This article recommends independent calibration or cross-checks along different paths, separating random-error intervals at fixed wave speeds from wave-speed uncertainty. Merely increasing the decimal precision of network arrival times does not imply a proportional improvement in source location.作者分析与复核建议 / Author analysis
Technical supplement C · Post-association residuals are subject to selection effects
Association algorithms generally favour picks that can be explained by some set of travel times, so the final residual distribution has already undergone selection. Reporting residuals only for successfully located events omits unassociated, rejected, and incorrectly merged objects. This article recommends tracking status from the full set of candidates, calculating recall using independently confirmed events, and then reporting location quality for successful events. If an algorithm upgrade reduces residuals but discards substantially more difficult events, this should be presented as a trade-off rather than declaring the entire catalogue better solely because residuals are lower.作者分析与复核建议 / Author analysis
Technical supplement D · Completeness correction must not exceed the support of the data
A detection-probability function can help explain thresholds, but true magnitudes, noise, and coverage may change together and may not be jointly identifiable from a single observed curve. This article recommends calibration using appropriate evidence, such as injections of known events, independent networks, or manual sampling, and providing sensitivity ranges under different assumptions. If the low-magnitude range contains no reliable information at all, extrapolated corrections may be determined primarily by the model, and the unknowns should be explicitly acknowledged. Catalogue version changes should list threshold and coverage differences so that researchers can assess whether trends remain comparable.作者分析与复核建议 / Author analysis
10. Conclusion: observation-chain reliability matters more than detection counts
Learned picking has greatly expanded the capacity to process vast waveform collections, but catalogue credibility depends on the full chain of measurement, association, location, and completeness. The travel-time and count derivations in this article show that a single error number or total count of newly detected events is insufficient to explain scientific gains. Published results should allow stations, waveforms, picks, event identities, and versions to be traced, while preserving noise and failure intervals. Only then can more sensitive algorithms become more reliable geophysical observations without mistaking changes in the observation system for changes in natural activity.作者分析与复核建议 / Author analysis
Core equations and derivations
(1) The P-S distance relationship for a homogeneous medium and approximately identical paths, not a general source-location method.
LaTeX
\Delta t=t_S-t_P=r\left(\frac1{v_S}-\frac1{v_P}\right)(2) First-order error propagation at fixed wave speeds; wave-speed and path uncertainty must be added separately.
LaTeX
\sigma_r=\frac{\sqrt{\sigma_P^2+\sigma_S^2-2\operatorname{Cov}(t_P,t_S)}}{v_S^{-1}-v_P^{-1}}(3) A constructed count curve obtained by selecting from the same latent distribution through detection probability.
LaTeX
N_{\mathrm{obs}}(m)=N_0\,10^{-b(m-m_0)}\,p_{\mathrm{det}}(m)(4) The smooth detection function used in this article; its parameters were not fitted to an actual network.
LaTeX
p_{\mathrm{det}}(m)=\frac1{1+\exp[-k(m-m_c)]}Methods and evidence workflow
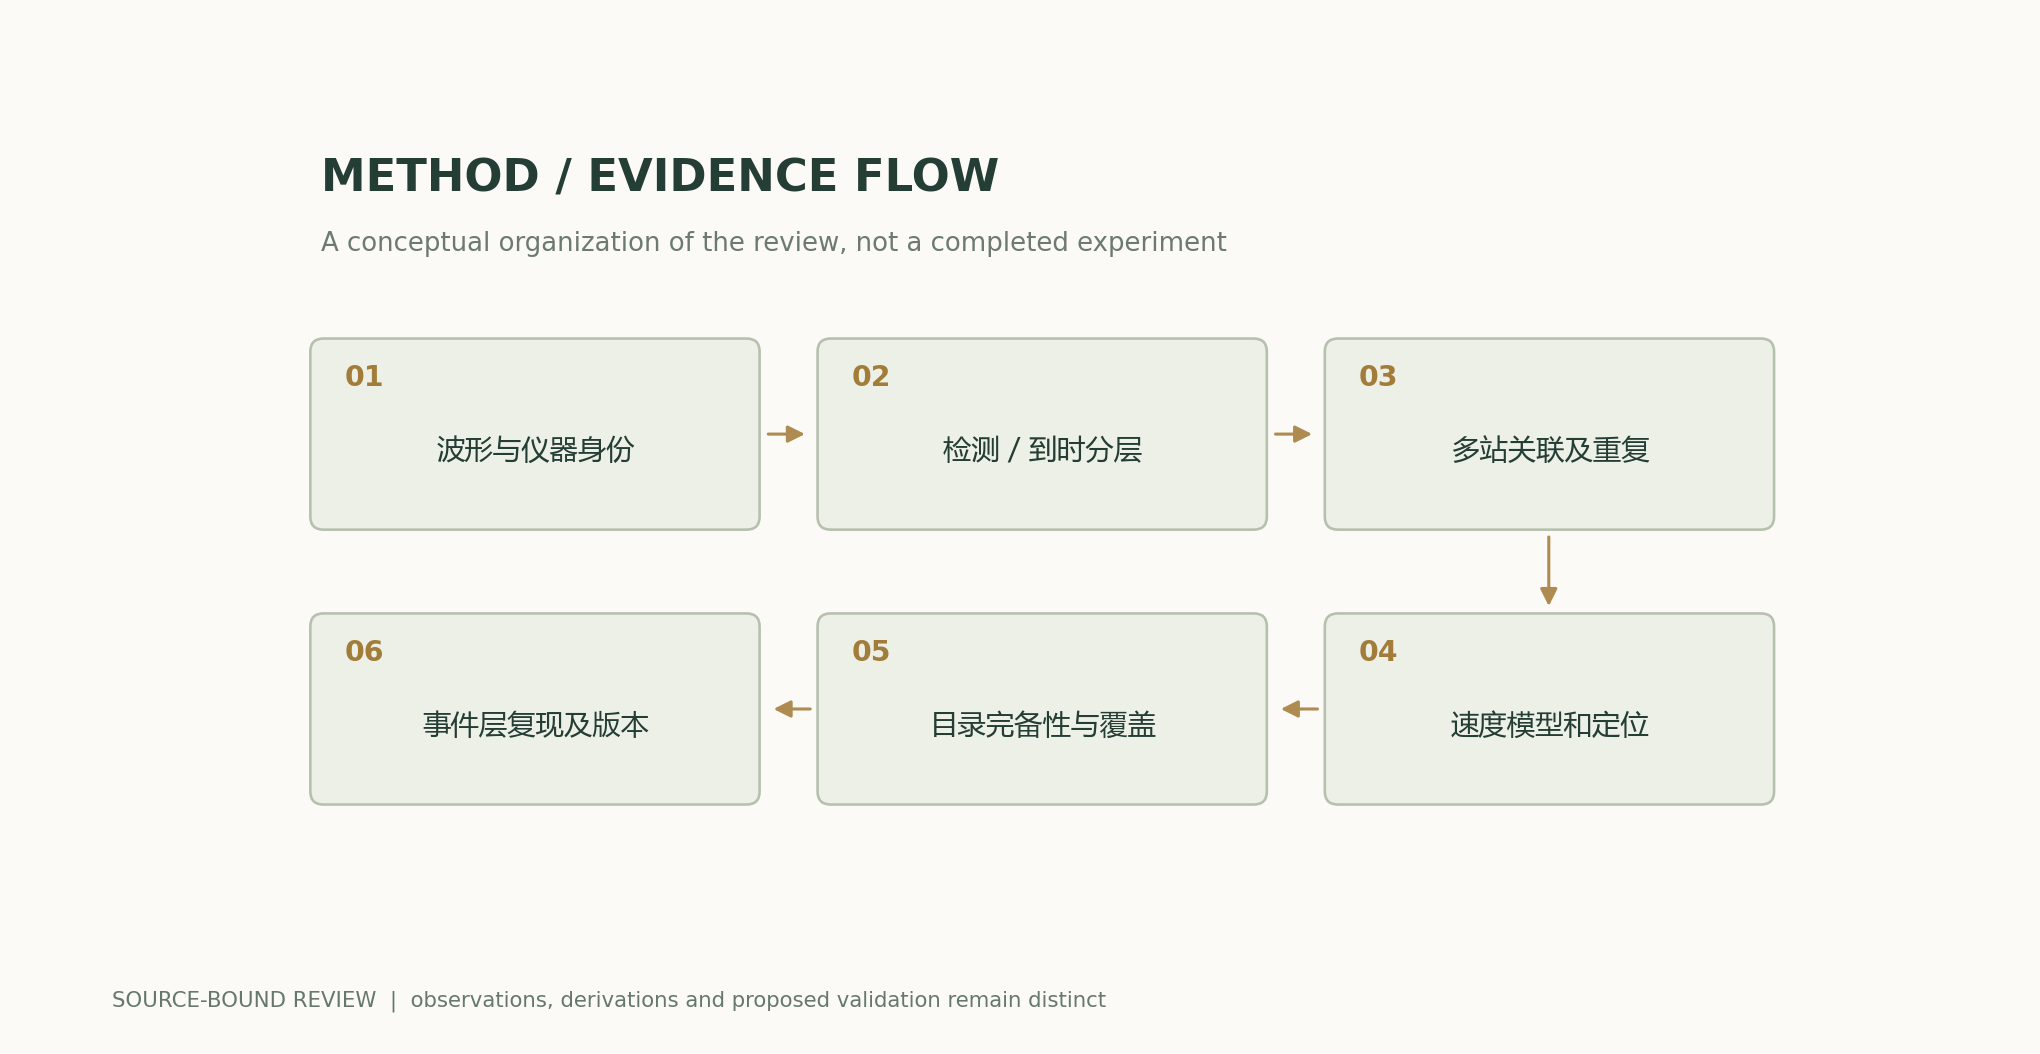
Analytical figures and numerical examples
Recomputable worked example
Distance coefficient 8.4 km/s; independent errors of 0.05 s for each phase give sigma_r≈0.593970 km. The same latent counts produce different observed curves under different thresholds.
Method comparison
| Stage | Endpoint and unit | Cannot substitute for |
|---|---|---|
| Waveform detection | False alarms / missed detections in continuous periods | Arrival-time accuracy |
| Seismic phase picking | Phase residuals and tails | Event location |
| Cross-station association | Merging, splitting, duplication | Low fitting residuals |
| Position estimation | Errors and station geometry | Single-station P-S distance |
| Catalogue counts | Observational completeness and coverage | Changes in the true activity rate |
| DAS transfer | Channel geometry and spatiotemporal holdouts | Treating adjacent channels as independent stations |
Verification and experimental plan
- Fix sampling rate, units, instrument response, components, and window rules.
- Evaluate event presence, phase-arrival times, and candidate-score calibration separately.
- Test window shifts, overlapping events, edges, and continuous event-free noise.
- Set a separate event-identity endpoint for association and location, retaining candidates and duplicates.
- Hold out data by region, network, instrument, and time interval.
- Standardize coverage, operating duration, and completeness definitions when comparing catalogues.
- Report intervals by event and time block; do not treat human references as absolutely complete.
- Deliver a version chain from waveforms to events; analytical figures are not to be used for early warning or earthquake prediction.
Scope and limitations
- Wave-speed, error, and count parameters are all constructed inputs.
- No seismic models were run and no real continuous waveforms were processed.
- The homogeneous-medium relationship cannot provide a general source location.
- The latent event distribution and detection efficiency may be difficult to identify jointly in real catalogues.
- This article provides no earthquake prediction or early-warning service.
Evidence from the original studies and its scope
| Original research findings | Scope | Source and location |
|---|---|---|
| Joint detection and picking, validated on specific continuous network data. | The proportion of newly detected events is tied to regional, station, and temporal settings. | Earthquake transformer—an attentive deep-learning model for simultaneous earthquake detection and phase pickingAbstract; Tottori application |
| Three-component waveforms produce P/S- and noise-related curves. | The picking-probability profile does not automatically equal a location posterior. | PhaseNet: a deep-neural-network-based seismic arrival-time picking methodSummary and model |
| Semi-supervised adaptation for DAS spatiotemporal observations. | Channels differ from conventional stations in observed quantities and dependencies. | Seismic arrival-time picking on distributed acoustic sensing data using semi-supervised learningMethods and adaptation |
Research questions worth testing
- Of the increase in catalogue entries, how much comes from lower thresholds and how much from changes in coverage?
- How does picking uncertainty propagate through association to source location?
- In transfer across instruments, are differences in representation, preprocessing, or annotation most important?
Primary sources and corresponding claims
- Earthquake transformer—an attentive deep-learning model for simultaneous earthquake detection and phase pickingMousavi et al. · 2020-08-07Single-station detection and P/S picking; 5-week Tottori study and downstream event location.
- PhaseNet: a deep-neural-network-based seismic arrival-time picking methodZhu and Beroza · 2018-10-13Three-component waveform segmentation; P/S/noise and Northern California training; journal issue 2019.
- Seismic arrival-time picking on distributed acoustic sensing data using semi-supervised learningZhu et al. · 2023Temporal-spatial DAS picker with pseudo-labels and phase association; sensor-domain distinction.
Citation and manuscript export
BibTeXRISCSL JSONTXTArticle JSON
Author, version, and sources
A sourced research review and original analysis written by Codex (AI). Experiments in the original papers belong to the original research teams; the calculations in this article test only the listed equations and explicit assumptions. This site does not yet have a record of independent peer review of this article or of original model, clinical, or physical experiments.
First published in the in-depth feature on AI and scientific discovery; section-by-section sources and the boundaries between original research evidence and the author's analysis are preserved.
The conceptual cover was generated by ImageGen. Scientific figures were plotted using the accompanying code and numerical files; captions specify assumptions and measurement definitions item by item.
Sources for the cover and scientific figures · Data, sources, and assumptions · Python · Recomputable code · Publication and version history
Source revision: b7b48f7205d705b2a3d3e8de0be5e1b458e4869c