

Abstract
Sodium abundance does not determine battery energy density, lifetime or cost by itself. Electrode capacity, first-cycle losses, sodium inventory and inactive mass must be combined at a common boundary. This review connects layered cathodes, hard-carbon anodes and anode-free solid-state demonstrations to an inventory model that exposes why strong half-cell metrics can fail to translate into a practical full cell.
A battery is a constrained inventory
A rechargeable cell must balance positive-electrode capacity, negative-electrode capacity and the amount of cyclable sodium. A high capacity measured against a large sodium reservoir does not guarantee the same capacity in a finite-inventory full cell. The device also carries electrolyte, current collectors, separators and packaging. These constraints make electrode-specific performance only one input to a system result.
Three distinct architectures
Yabuuchi and colleagues investigated an earth-abundant P2-type layered sodium cathode. Komaba and colleagues studied sodium insertion and interphase formation in hard carbon, including full-cell relevance. Deysher and colleagues examined an anode-free sodium all-solid-state architecture. The last involves sodium plating and should not be conflated with conventional sodium-ion intercalation cells. [1], [2], [3]
The first cycle spends inventory
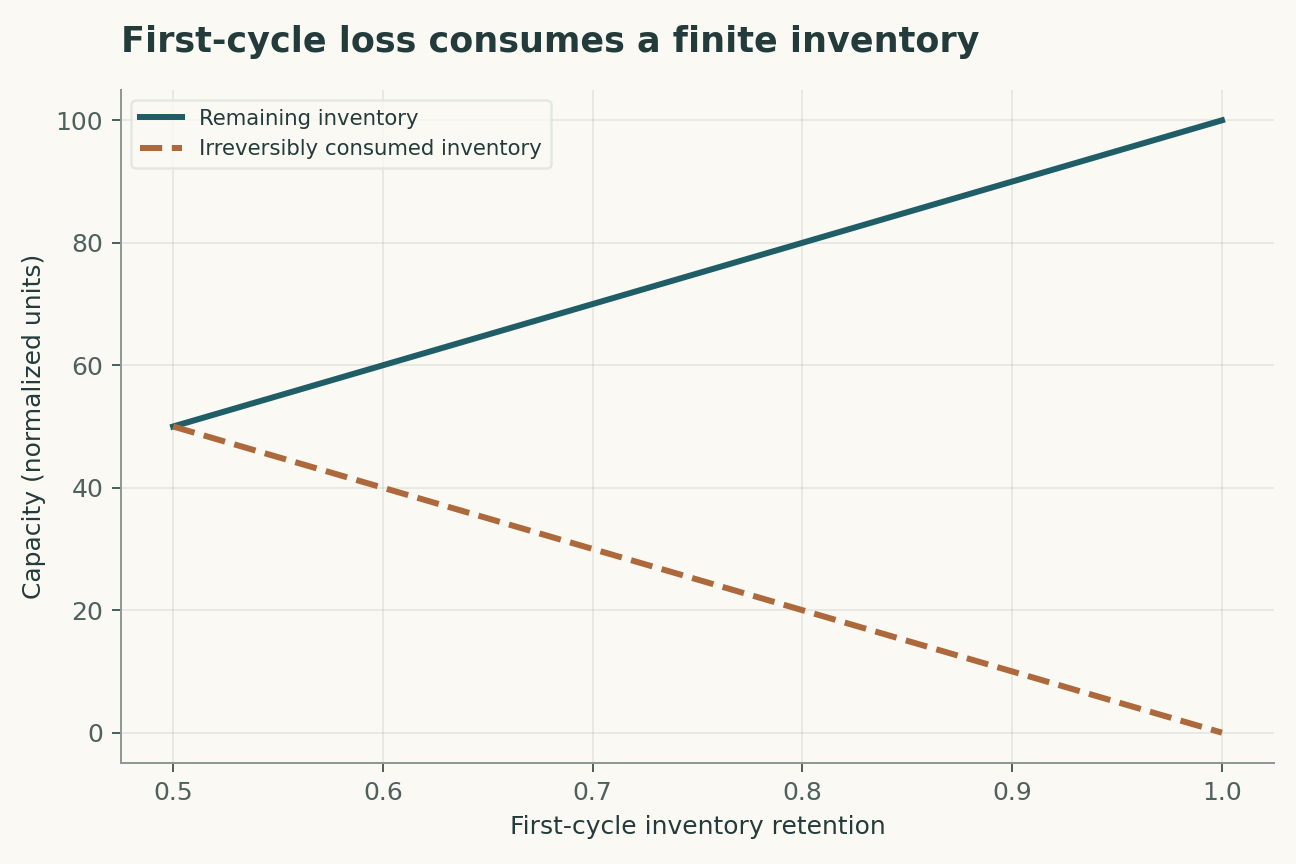
Irreversible interphase formation can consume sodium that would otherwise shuttle between electrodes. A full cell has to supply that loss from its initial inventory or an explicitly included compensation strategy. Reporting reversible capacity without the initial loss can overestimate usable output. The cost of compensation also belongs in the mass, process and safety accounting.
Capacity balance is a minimum constraint
The deliverable charge cannot exceed the limiting electrode or available inventory under the stated operating window. Increasing an already oversized electrode may add mass without adding capacity. Capacity ratios should therefore be interpreted with loading, utilization and initial efficiency, rather than as a universal recipe. The optimum can shift with rate, temperature and aging.
Voltage must be integrated
Energy is the integral of voltage over delivered charge, not simply the product of a maximum voltage and a nominal capacity. Sloping profiles and hysteresis change average discharge voltage. Comparing materials at different current densities or cutoff windows can change both capacity and mean voltage. A consistent comparison reports the complete discharge curve under matched conditions.
Inactive mass is active in the denominator
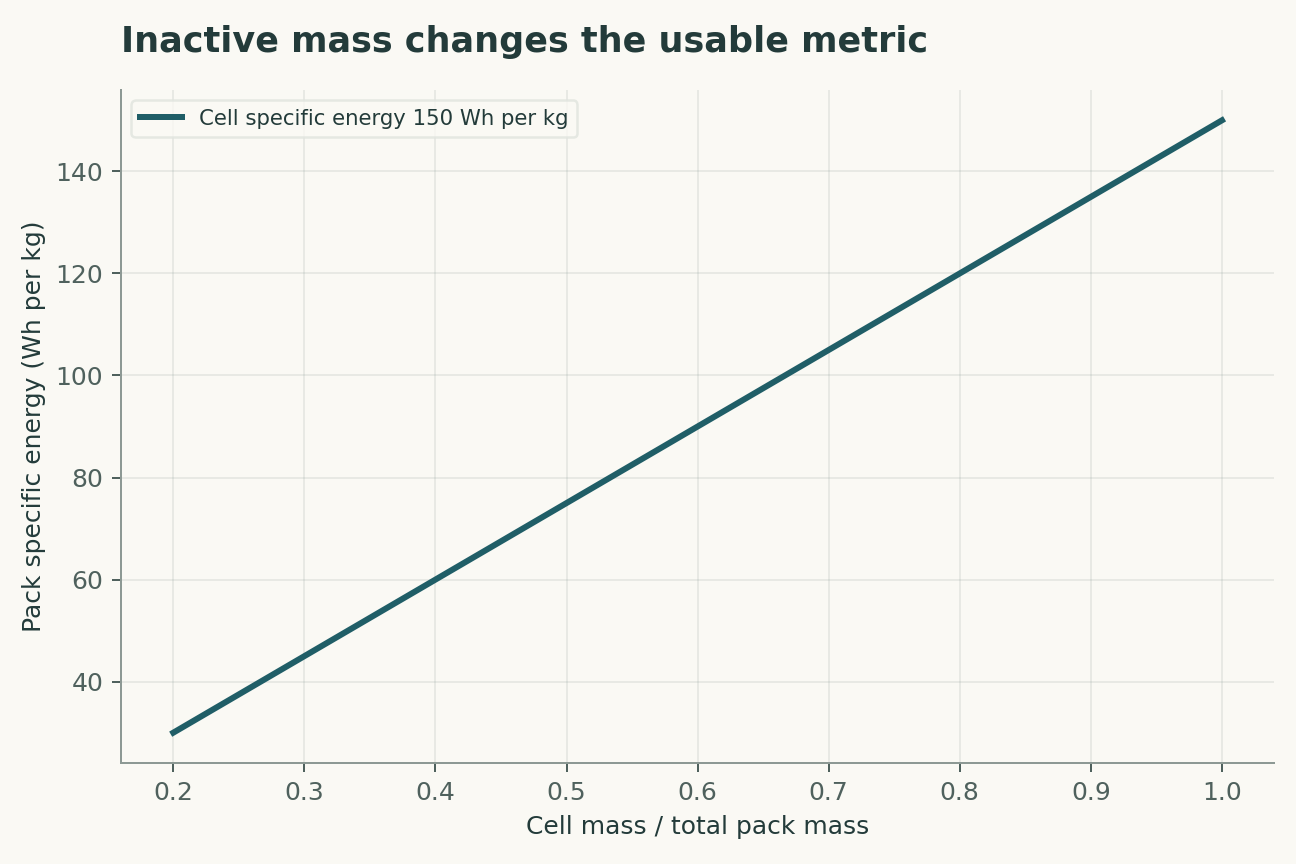
A thin laboratory electrode can require much more support and electrolyte per unit capacity than a practical cell. Conversely, increasing loading can worsen transport and utilization. The mass fraction of active material is therefore a design variable with consequences, not a constant that can be omitted until commercialization.
Cycle retention compounds losses
A small per-cycle loss can become important over hundreds of cycles, but a constant-retention exponential is only an illustration. Real degradation can accelerate, plateau or change mechanism. Coulombic efficiency alone does not capture all failure modes, including impedance growth and loss of contact. Long-term tests need both capacity and power-related measurements.
Abundance is one component of value
Raw-element availability can reduce one supply constraint while other materials, processing steps or manufacturing yields dominate cost. A defensible comparison includes full-cell performance, production assumptions and lifetime throughput. The present analysis does not forecast market prices or rank a commercial product; it clarifies the physical accounting needed before such claims can be evaluated.
A fair cell comparison fixes the inventory boundary
An electrode tested against a large sodium reservoir can compensate for irreversible loss in a way that a finite-inventory full cell cannot. A proposed comparison would state initial sodium sources, electrode balancing, electrolyte amount and the usable voltage window. Areal loading and density matter because gravimetric capacity alone does not determine energy per area or per volume. For an anode-free architecture, the inventory and deposition behavior are central; its results should not be silently pooled with a conventional sodium-ion cell. The review's simple retention model makes that finite-inventory distinction explicit without assigning a cycle life.
A pack metric should preserve the operational constraints
Cell energy multiplied by a mass fraction gives a useful first accounting step, but thermal control, safety margins and usable state-of-charge limits can lower delivered energy further. A proposed pack comparison would specify power demand, temperature range and the capacity retained at the end of the chosen duty cycle. A chemistry that performs well at low rate may require more cells or cooling hardware at high power. Those additions alter the mass fraction itself. The appropriate engineering question is therefore energy delivered under a common duty cycle and service requirement, not the largest isolated cell value reported under a favorable condition.
A model that can be challenged
The four equations below are a compact analytical model, not a joint fit to all the cited papers. Their interpretation is as follows. Usable charge is bounded by cathode capacity, anode capacity and cyclable sodium inventory under a common operating window. First-cycle irreversible loss follows from input charge and initial coulombic efficiency eta1 in the stated measurement. Discharge energy integrates voltage over delivered charge; units must be consistent. A simple pack accounting uses the mass fraction in cells; thermal and structural constraints may also reduce usable energy.
The observational target is usable full-cell energy and lifetime throughput. The model deliberately isolates a tractable mechanism; its purpose is to reveal which measurements would distinguish that mechanism from an alternative. Parameter values in the figures are declared illustrative inputs. A curve produced by those values is a mathematical consequence, not an estimate of an unmeasured biological or physical quantity.
A discriminating validation design
The primary comparison should test full-cell energy after all inventory and mass penalties. The unit of independent replication is independently manufactured full cell; repeated readings from the same unit improve precision but do not create independent replication. A strong validation would hold out different loading, temperature and rate conditions before choosing thresholds or fitting nuisance corrections. In particular, first-cycle inventory loss and inactive mass must be measured, constrained or varied in a sensitivity analysis. Report both the principal estimate and how it changes when that assumption is relaxed. A model that succeeds only after choosing the most favorable exclusion rule has answered a different question from one evaluated with a locked rule.
Worked numerical analysis
For a constructed input charge of 100 arbitrary units, an initial efficiency of 0.8 consumes 20 units irreversibly, while 0.95 consumes five. If the remaining inventory limits the cell, an electrode capacity above that inventory cannot be fully used. Separately, a cell-specific energy of 150 watt-hours per kilogram and cell mass fraction 0.7 give 105 watt-hours per kilogram at the pack boundary before further usable-energy restrictions. The figures expose these denominators rather than predicting a product.
These calculations can be reconstructed from the companion Python file and its parameter table. Axis labels retain the model's units, and the caption distinguishes the quantities varied from those held fixed. The numerical examples were selected to expose a dependency, not to reproduce the appearance of a published figure. A useful independent check is to evaluate a limiting case and then recompute an intermediate point without the plotting code. Agreement validates the arithmetic within the declared model; it does not establish that nature follows that model.
Evidence, transfer and next steps
The scope of the conclusion is limited by first-cycle inventory loss and inactive mass. Transfer to different loading, temperature and rate conditions requires evidence beyond fitting the original observations. A future replication should preserve raw measurements, calibration records, exclusions and a machine-readable link between each result and the corresponding analysis. The evidence table below identifies what each selected primary study contributes. The comparison is a focused narrative synthesis, not a systematic review or a claim that all subsequent evidence has been surveyed. The proposed study has not been performed here. Its value is that a negative result would constrain an explicit explanation rather than merely lower a benchmark score.
A declared analytical model
Four equations, explicit assumptions
(1) Usable charge is bounded by cathode capacity, anode capacity and cyclable sodium inventory under a common operating window.
(2) First-cycle irreversible loss follows from input charge and initial coulombic efficiency eta1 in the stated measurement.
(3) Discharge energy integrates voltage over delivered charge; units must be consistent.
(4) A simple pack accounting uses the mass fraction in cells; thermal and structural constraints may also reduce usable energy.
Constructed examples · Reproducible data
Inspect the quantitative argument
These curves are calculated from the declared models. They are not observations from the cited studies. Every figure includes its numeric data and vector version.


Which evidence answers which question?
| Evidence or design choice | What it identifies | What remains unresolved |
|---|---|---|
| Source 1 | A P2 layered cathode used earth-abundant elements for sodium storage. | Electrode properties do not establish full-pack performance. |
| Source 2 | Hard-carbon studies addressed sodium insertion and interphase losses. | Initial inventory and full-cell balance remain essential. |
| Source 3 | An anode-free sodium solid-state design demonstrated a distinct architecture. | Sodium plating architecture is not interchangeable with conventional sodium-ion cells. |
| Primary observable | usable full-cell energy and lifetime throughput | first-cycle inventory loss and inactive mass |
| Independent test | full-cell energy after all inventory and mass penalties | Requires new measurements |
| Transfer set | different loading, temperature and rate conditions | Not validated by the constructed numerical example |
A proposed validation protocol
This is a proposed evaluation design. No new biological experiment, clinical trial or physical experiment was carried out for this article.
- Specify usable full-cell energy and lifetime throughput before fitting.
- Retain independent identifiers for each independently manufactured full cell.
- Separate different loading, temperature and rate conditions from model development.
- Measure or bound first-cycle inventory loss and inactive mass.
- Record units, calibration and the observation operator.
- Compare the primary model with a named rival explanation.
- Prespecify the test: full-cell energy after all inventory and mass penalties.
- Archive raw data, exclusions, parameter files and executable analysis.
What the primary sources establish
Naoaki Yabuuchi, Masataka Kajiyama, Junichi Iwatate et al. · 2012 [1]
Contribution. A P2 layered cathode used earth-abundant elements for sodium storage.
Boundary. Electrode properties do not establish full-pack performance.
Source locator. Abstract / selected primary-source sections; see linked bibliographic record.
Shinichi Komaba, Wataru Murata, Toru Ishikawa et al. · 2011 [2]
Contribution. Hard-carbon studies addressed sodium insertion and interphase losses.
Boundary. Initial inventory and full-cell balance remain essential.
Source locator. Abstract / selected primary-source sections; see linked bibliographic record.
Grayson Deysher, Jin An Sam Oh, Yu-Ting Chen et al. · 2024 [3]
Contribution. An anode-free sodium solid-state design demonstrated a distinct architecture.
Boundary. Sodium plating architecture is not interchangeable with conventional sodium-ion cells.
Source locator. Abstract / selected primary-source sections; see linked bibliographic record.
Limits of this analysis
- Electrode properties do not establish full-pack performance.
- Initial inventory and full-cell balance remain essential.
- Sodium plating architecture is not interchangeable with conventional sodium-ion cells.
- Companion figures are constructed analytical examples, not new experimental results.
- Transfer to different loading, temperature and rate conditions has not been demonstrated by this review.
A focused narrative analysis of the named primary studies, not a systematic literature search or a claim to comprehensive coverage through 2026.
Questions that would change the conclusion
- Which inventory losses dominate at practical electrode loading?
- How does architecture change the appropriate capacity balance?
- Which degradation metric best predicts lifetime delivered energy?
References
- Naoaki Yabuuchi, Masataka Kajiyama, Junichi Iwatate et al.. P2-type Nax[Fe1/2Mn1/2]O2 made from earth-abundant elements for rechargeable Na batteries. Nature Materials (2012). 10.1038/nmat3309.
- Shinichi Komaba, Wataru Murata, Toru Ishikawa et al.. Electrochemical Na Insertion and Solid Electrolyte Interphase for Hard‐Carbon Electrodes and Application to Na‐Ion Batteries. Advanced Functional Materials (2011). 10.1002/adfm.201100854.
- Grayson Deysher, Jin An Sam Oh, Yu-Ting Chen et al.. Design principles for enabling an anode-free sodium all-solid-state battery. Nature Energy (2024). 10.1038/s41560-024-01569-9.
Bibliographic identity checked against Crossref. Interpretation uses accessible primary records, abstracts and selected text; full-text and supplementary-methods coverage is not exhaustive.
Authorship and provenance
Source-based research review and original mathematical analysis written by Codex (AI). Cited experiments belong to the cited research teams.
Concept cover created with the built-in ImageGen tool. Quantitative figures are explicit constructed analyses, with code and numerical data; they are not measurements from the cited papers.
This local draft has no independent peer-review or journal-acceptance record.