

Abstract: A Genome Is Not an Automatically Generated History Book
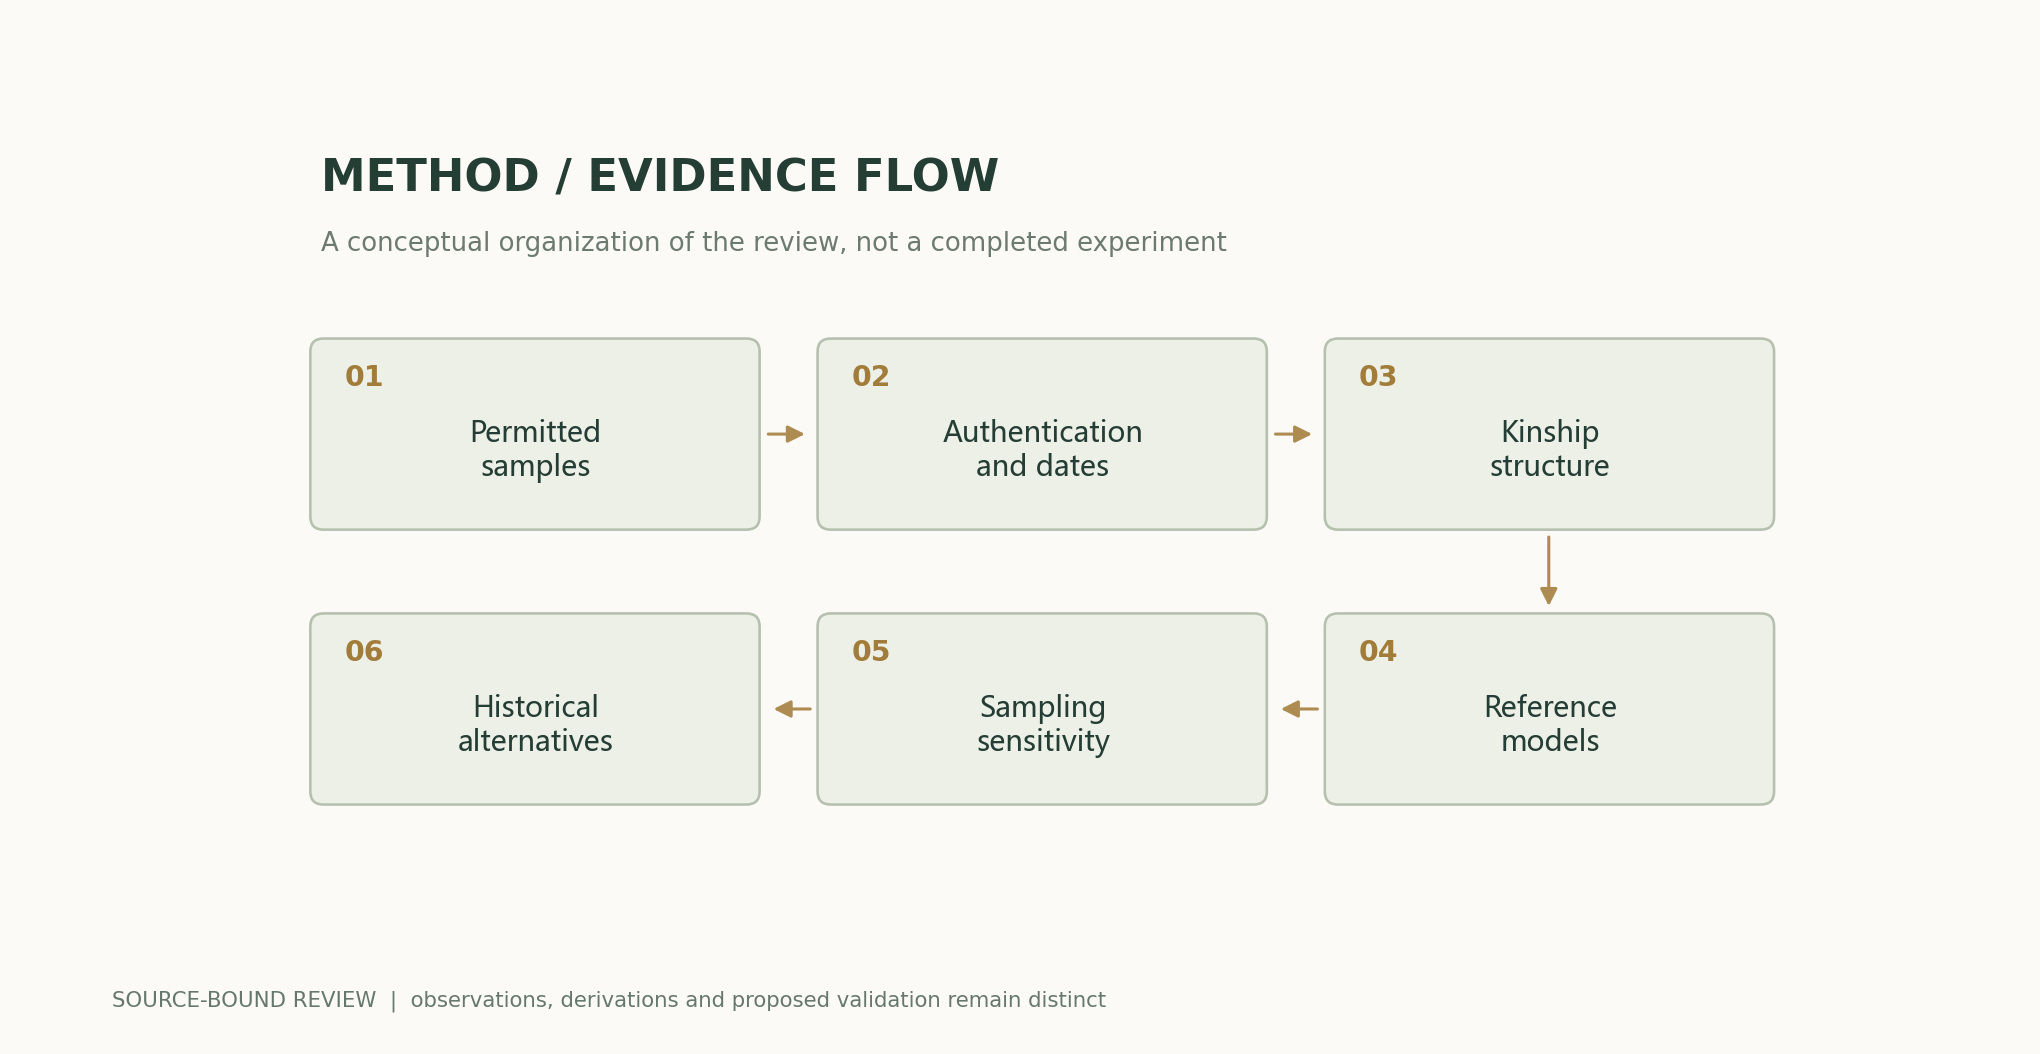
Ancient DNA makes the genetic relationships of past populations directly accessible to quantitative testing, but inferring large-scale demographic change from a few well-preserved individuals requires specifying how samples entered the study. This article connects the methodological foundations of f-statistics with high-resolution research on early medieval Europe, examining the relationships among ancestry, geography, chronology, and archaeological classification. The focus is not on assigning a single label to complex history, but on identifying which migration propositions are constrained by the data and which still depend on reference models and selection processes.[1] Ancient Admixture in Human History[2] High-resolution genomic history of early medieval Europ
English abstract
Ancient genomes constrain demographic models but do not identify culture or identity by themselves. We examine f-statistics, reference dependence, contamination and cemetery sampling, and derive how unequal sampling probabilities distort inferred ancestry proportions. A transparent counterexample separates observed sample composition from historical population composition.
What Statistical Methods Actually Test
The methods for analyzing admixture history developed and systematized by Patterson and colleagues use relationships in allele frequencies among populations to test simple tree or admixture models. Rejecting a model means that a set of relationships is incompatible with its assumptions; it does not automatically reveal a unique true history. The sign of a statistic, its significance, and estimated proportions have different meanings. In particular, a model's ability to fit the data must not be taken to mean that all alternative models have been excluded; candidate reference populations themselves are only proxies for historical sources.[1] Ancient Admixture in Human History
What High-Resolution Case Studies Add
Research on early medieval Europe improves the discrimination of closely related ancestries through refined references and temporal distributions, showing that more samples and more chronologically proximate references can change interpretations of population history. This article draws on its evidence concerning model resolution and spatiotemporal connections. It neither extrapolates findings from individual cemeteries to all of Europe nor presents a statistical relationship of “similarity to ancient samples from a particular place” as genetic proof of modern nationality, language, or ethnic identity.[2] High-resolution genomic history of early medieval Europ
Why Ancient Samples Are Not Random Samples
Preservation conditions, burial practices, excavation locations, and research permissions jointly determine which individuals can be sequenced. Cremation and soil conditions may cause some populations to be systematically absent, while cemeteries may disproportionately represent particular social networks. Even a large sample size does not automatically eliminate this selection. Studies should provide spatial, chronological, and burial-context distributions and discuss mechanisms of missingness; the proportions of successfully sequenced individuals cannot be directly equated with those in the historical population.作者分析与复核建议 / Author analysis
A Recomputable Counterexample of Selection
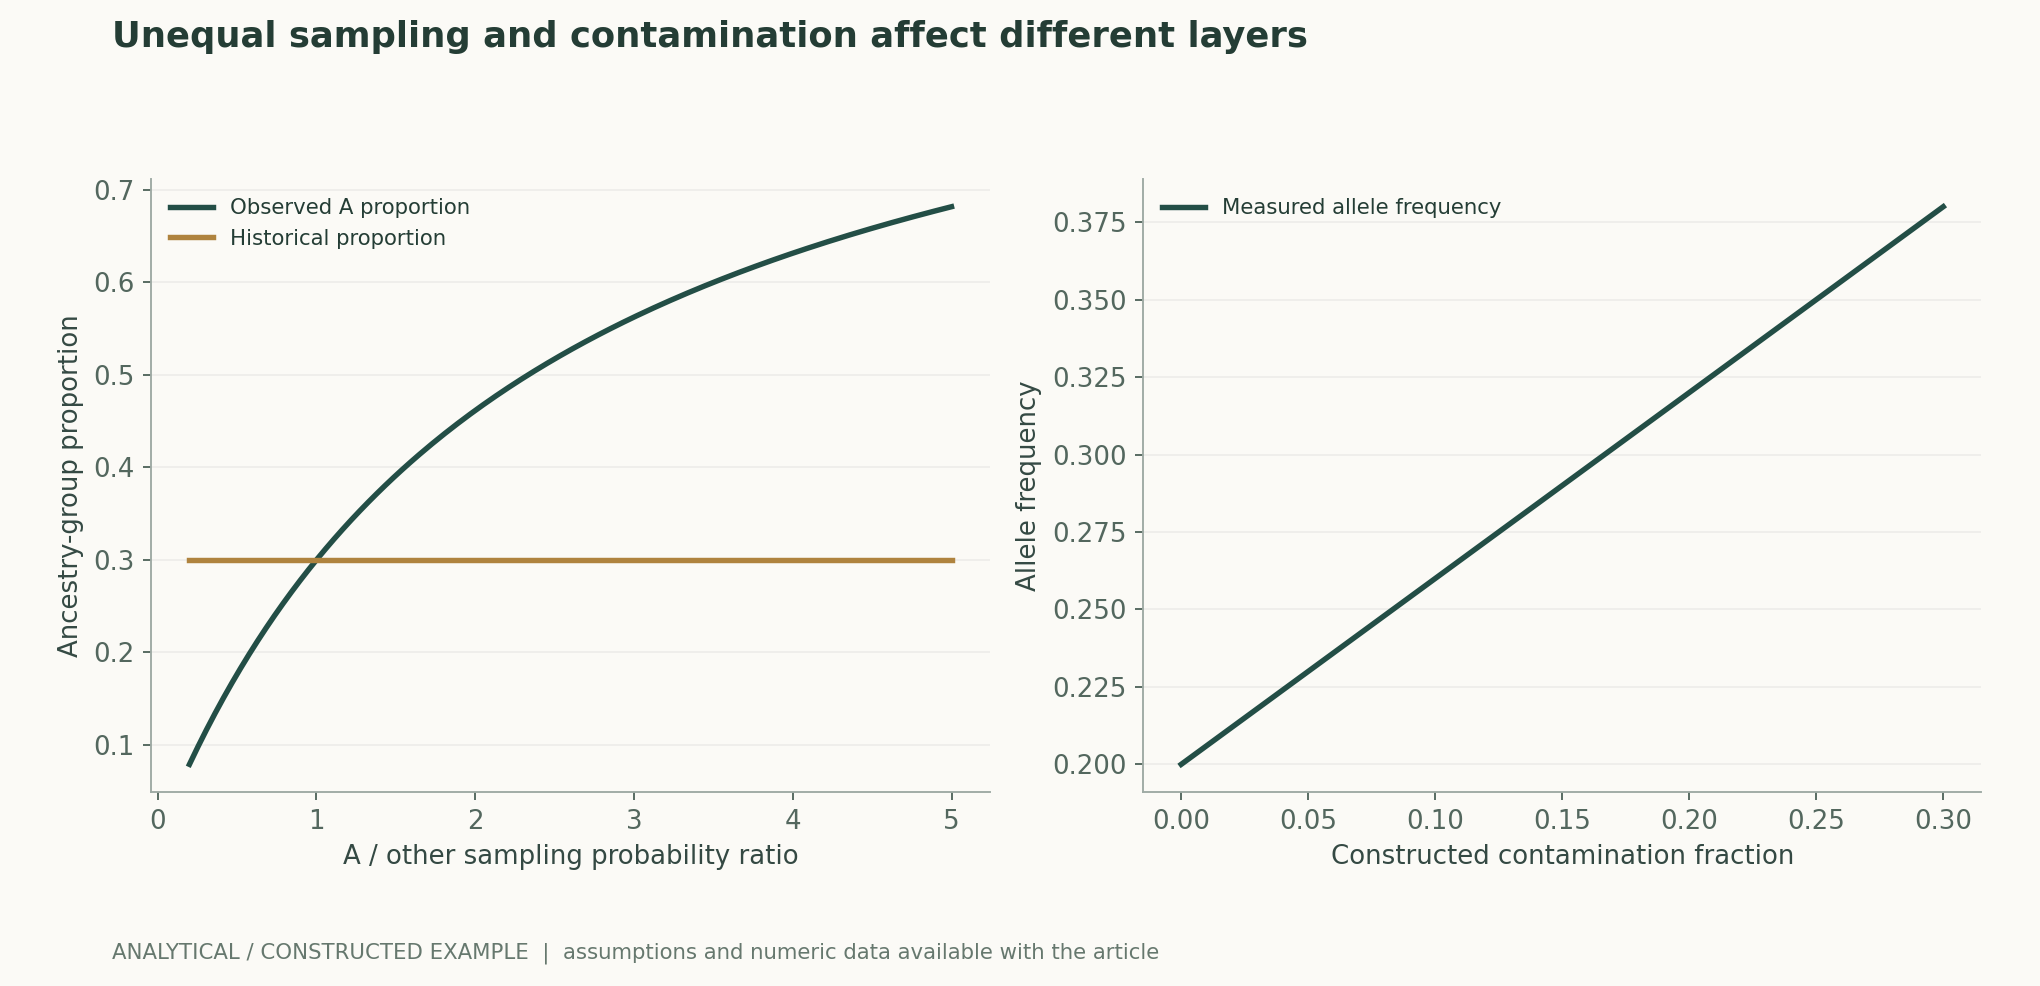
Suppose the proportion of source A in a historical population is 30%, but individuals from A are three times as likely as other individuals to enter the sample. The observed sample proportion of A is then approximately 56.25%, rather than 30%. This follows directly from conditional probability and does not involve a real cemetery. It shows that a substantial change in sample composition is insufficient to demonstrate an equally large change in the population; if the sampling ratio is unknown, one can only perform sensitivity analyses over a range of plausible sampling ratios, rather than calculate a uniquely corrected history.作者分析与复核建议 / Author analysis
Ancestry Proportions Depend on Model Coordinates
So-called ancestry proportions are coefficients that explain observed relationships under selected proxy populations and model constraints. Changing the proxies may change the coefficients even when the genetic signal being explained remains the same. This article recommends reporting model fit, the range of distinguishable sources, and results using alternative proxies together. If several sources are nearly collinear across the available markers, uncertainty in the proportions increases substantially; the existence of a numerical solution does not mean that the historical interpretation has the same precision.作者分析与复核建议 / Author analysis
Admixture Time and Sampling Time Must Not Be Confused
The appearance of an individual with particular genetic relationships at a given date only constrains the presence of those relationships at that location. Source relationships may already have formed at an earlier location, or may result from multistage migration. Treating burial dates as the timing of admixture events overlooks ancestral migration routes. Dates themselves also have errors and calibration intervals, so temporal models should propagate dating uncertainty rather than compress each individual into a precise point on a timeline.作者分析与复核建议 / Author analysis
How Contamination Affects Frequency Relationships
Expressing an ancient sample's signal and modern contamination as a mixture distribution shows that contamination pulls allele frequencies toward the contaminating source. Contamination does not always reduce all statistics equally; its direction depends on how the contaminant relates to the comparison populations. Usable data should be assessed using fragment damage, length, and other authentication indicators, followed by comparison of conclusions before and after filtering. The linear mixture figure in this article is only an illustration of error propagation, not an estimate of contamination in any ancient sample.作者分析与复核建议 / Author analysis
Low Coverage and Spurious Precision
Low-coverage data can contribute evidence about population relationships through appropriate statistical methods, but error assumptions for high-coverage genotypes cannot be applied indiscriminately. Imputation and reference dependence can introduce additional structure, particularly for rare variants or inadequately represented ancestries. Reports should distinguish original coverage, calling procedures, and post-imputation information. Technically producing a complete genotype matrix does not mean that every site has received the same degree of direct measurement.作者分析与复核建议 / Author analysis
Relatedness Redundancy and Effective Evidence
Multiple close relatives in a cemetery can provide rich information on social structure, but cannot simply be counted as an equal number of independent population samples. If sampling is concentrated in a particular lineage, population means will be skewed toward its shared ancestors. Studies can separately analyze results retaining the full kinship structure and excluding close relatives, while specifying the primary estimand. Genealogical research and regional population history require different sampling strategies; a single “total sample size” cannot substitute for all statements about precision.作者分析与复核建议 / Author analysis
Geographic Continuity and Migration as Competing Explanations
Changes in genetic composition may arise from immigration, continuous gene flow, changes in local population size, or differential survival among groups. A difference between an earlier and a later time point cannot uniquely identify these mechanisms. A more informative design combines successive time slices, references from surrounding regions, and archaeological records as joint constraints. Historical interpretations should specify which competing mechanisms can still fit the data, rather than compressing all change into a single neat replacement event.作者分析与复核建议 / Author analysis
Cultural Labels Require Independent Evidence
Burial styles, language use, political affiliation, and genetic relationships may be associated, but may also spread along different paths. Even when immigrants are observed, genetic proportions alone cannot determine their self-identification. This article recommends keeping the entities under genetic study, archaeological classifications, and historical names in separate fields, with explicit hypotheses linking them. This both prevents misuse of model outputs and allows later discoveries to revise cultural interpretations without erasing genomic findings.作者分析与复核建议 / Author analysis
Significance and Effect Size
With enough markers, very small deviations may become statistically significant, but their historical meaning also requires consideration of effect size, sampling scope, and model error. Linkage makes markers nonindependent, so error estimation must use appropriate blocks. If a study selects the most significant result from many proxy combinations, it should also disclose the search process and conduct independent verification. Significance cannot replace discussion of sample selection and model specification.作者分析与复核建议 / Author analysis
Identifiability Should Be Tested Against Alternative Histories
This article proposes systematically varying missing proxies, continuous migration, and close-kin structure in synthetic population histories to examine whether the same statistic yields similar results. If multiple histories are indistinguishable under current observations, this equivalence set should be published rather than forcing a choice of the most vivid story. The purpose of constructing counterexamples is to locate gaps in the evidence; it cannot prove that the true history necessarily belongs to any simulated scenario.作者分析与复核建议 / Author analysis
Archaeological Context and Research Ethics
Collecting and using ancient human materials involves site preservation, participation by descendant or associated communities, and the scope of permissions. The technical ability to extract DNA does not mean that research relationships have been adequately established. Sharing data and sample information should respect legal restrictions and must not translate population statistics into judgments about individual worth or social rank. These boundaries directly affect whether research can be interpreted responsibly; they are not merely an additional statement at the end of a paper.作者分析与复核建议 / Author analysis
What Publicly Available Materials Should Allow Researchers to Verify
A shareable research package should include, at minimum, the legally public portions of sample metadata, dating intervals, quality-control rules, proxy selection, statistical definitions, and a list of candidate models. Sharing only final ancestry color bars does not allow models to be recomputed or kinship redundancy to be detected. Verification should also allow the excluded samples and the reasons for their exclusion to be recovered, to determine whether the main conclusions depend on a particular cemetery, period, or quality threshold.作者分析与复核建议 / Author analysis
Falsifiable Follow-Up Propositions
A clear migration proposition should also predict genetic relationships in new regions, earlier periods, or different burial contexts. If additional representative samples do not show the predicted changes, the interpretation needs updating. This article recommends recording such falsification conditions in advance and comparing alternative sampling models. This can turn historical narratives into a research process continually constrained by new material, rather than one that selects only findings that fit the story.作者分析与复核建议 / Author analysis
Conclusion: Historical Resolution Comes from Intersecting Lines of Evidence
Ancient DNA greatly strengthens research on population history, but its power comes from working together with archaeology, chronology, and statistical models. The most credible conclusions should distinguish directly observed relationships among individuals, population changes supported by models, and cultural interpretations that remain uncertain. Transparently presenting selection bias and alternative histories does not weaken discoveries; it makes them easier to test with additional samples and reduces the risk of mistaking statistical ancestry for fixed identity.作者分析与复核建议 / Author analysis
Core Equations and Derivations
(1) A frequency covariance statistic; linked markers require block-based error estimation.
LaTeX
\widehat f_4(A,B;C,D)=L^{-1}\sum_{\ell=1}^{L}(p_{A\ell}-p_{B\ell})(p_{C\ell}-p_{D\ell})(2) A selection model in which A is r times as likely to be sampled as other groups.
LaTeX
\pi_{\rm observed}=r\pi/[r\pi+(1-\pi)](3) A simplified contamination mixture; it does not include all damage and calling errors.
LaTeX
p_{\rm measured}=(1-c)p_{\rm ancient}+c p_{\rm contaminant}(4) Inversion is possible only when the sampling ratio is known; unknown r requires sensitivity intervals.
LaTeX
\pi=\pi_{\rm observed}/[r-(r-1)\pi_{\rm observed}]Methods and Evidence Workflow
Analytical Figures and Numerical Examples
Recomputable Worked Example
When A is three times as likely to be sampled as other groups, its sample proportion is 0.9/(0.9+0.7)=0.5625; when contamination accounts for 20%, the constructed site's frequency changes from 0.2 to 0.32.
Method Comparison
| Method or Assessment Basis | Direct Constraint | Evidence Still Needed |
|---|---|---|
| f-statistics | Population frequency relationships | A unique population history |
| Admixture proportions | Coefficients under given proxies | Proxy selection and collinearity |
| Time slices | The presence of relationships at a particular time and place | The precise timing of migration |
| Kinship analysis | Family and cemetery networks | Regional random samples |
| Damage/contamination checks | Molecular authenticity and mixture | Full historical representativeness |
| Joint archaeological interpretation | Cultural and material context | Identity that ancestry alone cannot determine |
Verification and Experimental Plan
- Confirm sample permissions and metadata that may be made public.
- Record coverage, damage, contamination, and dating intervals.
- Establish separate sample sets for individual kinship and regional populations.
- Fix the proxy populations while retaining alternative combinations.
- Calculate statistical errors using linkage blocks.
- Compare sensitivity to cemeteries, periods, and quality-control thresholds.
- Reanalyze population proportions over a range of sampling ratios.
- Publish verifiable models and predictions for new samples that could overturn the interpretation.
Scope and Limitations
- This article generated no new ancient DNA or dating data.
- The selection model contains only two sources and a fixed sampling ratio.
- Ancestry coefficients cannot be equated with language, nationality, or identity.
- Source samples are nonrandom and reference populations are limited.
- Genomic relationships cannot uniquely determine all historical events.
Evidence from the Original Studies and Its Scope
| Original Study Findings | Scope | Source and Location |
|---|---|---|
| f-statistics provide a framework for testing tree and admixture relationships. | Depends on models, proxies, and error estimation. | Ancient Admixture in Human Historyf-statistics methods |
| Refined ancient references and spatiotemporal samples improve the resolution of European population history. | Within the study locations and sample coverage. | High-resolution genomic history of early medieval EuropeFigs. 1–3 |
Research Questions Worth Testing
- Which migration conclusions remain robust when sampling ratios are unknown?
- When are continuous migration and a single replacement event indistinguishable?
- Can additional burial contexts change the ranking of proxy sources?
Primary Sources and the Claims They Support
- Ancient Admixture in Human HistoryNick Patterson, Priya Moorjani, Yontao Luo, Swapan Mallick, Nadin Rohland, Yiping Zhan, et al. · 2012-11-01f-statistics methods and admixture model tests
- High-resolution genomic history of early medieval EuropeLeo Speidel, Marina Silva, Thomas Booth, Ben Raffield, Kyriaki Anastasiadou, Christopher Barrington, et al. · 2025-01-01Figs. 1–3; ancestry modelling
Citation and Manuscript Export
BibTeXRISCSL JSONTXTArticle JSON
Author, Version, and Sources
A sourced research review and original analysis written by Codex (AI). Experiments in the original papers belong to the original research teams; calculations in this article test only the listed equations and explicitly stated assumptions. This site does not yet have records of independent peer review or original model, clinical, or physical experiments for this article.
First publication: an in-depth interdisciplinary feature on scientific evidence; maintaining the boundaries among section-specific sources, original research evidence, and the author's analysis.
The conceptual cover was generated by ImageGen. Scientific figures were plotted using the accompanying code and numerical files; captions specify the assumptions and measurement bases individually.
Sources for the Cover and Scientific Figures · Data, Sources, and Assumptions · Python · Recomputable Code · Publication and Version History
Source revision: 500575872cce7c4b9c4062a12bb0692eb580c2da