

Abstract
Leaderboards compress complex capabilities into a single number, facilitating comparison while readily obscuring the effects of sample selection, annotation, contamination, and aggregation weights. Building on existing multidimensional evaluation frameworks, this review adds statistical derivations, paired comparisons, and data governance analysis to explain why high scores alone still cannot answer questions about reliability, transferability, or actual workloads. The added confidence-interval and contamination-mixture examples are calculations based on publicly available formulas, not empirical measurements of any model in use. We recommend publishing the evaluation target, code, samples, and distribution of failures together, rather than publishing rankings alone.[1] Measuring Massive Multitask Language Understanding[2] Holistic Evaluation of Language Models[3] MMMU: A Massive Multi-discipline Multimodal Understandi
English abstract
Benchmark scores are treated as measurements with sampling, annotation and selection uncertainty. The review derives finite-sample accuracy intervals, distinguishes paired from independent model comparisons, and explains why aggregate rankings can reverse under task reweighting. Contamination control and an auditable evaluation manifest are necessary to interpret an apparent improvement; the numerical examples are constructed statistical calculations.
1. MMLU expands the coverage of knowledge testing
MMLU includes 57 academic and professional tasks, allowing researchers to observe differences in model performance across domains. An average across tasks can provide a useful overview, but may conceal failures in a particular domain. Performance on multiple-choice questions also cannot be directly equated with open-ended consultation, execution of long tasks, or attainment of professional qualifications. The benchmark's contribution is to provide a comparable set of questions, not to replace all real-world validation.[1] Measuring Massive Multitask Language Understanding
2. HELM shows that accuracy is only one dimension
HELM incorporates accuracy, calibration, robustness, fairness, bias, toxicity, and efficiency into its evaluation framework, and specifies which dimensions can be measured in which scenarios. The importance of this design lies in making coverage gaps and trade-offs public. Metrics with different meanings and units must not be arbitrarily summed into a single “comprehensive intelligence score,” nor should cells that have not yet been measured be filled with zero scores.[2] Holistic Evaluation of Language Models
3. Multimodal questions change what is being measured
MMMU tests knowledge and reasoning through interdisciplinary image-and-text questions, comprising approximately 1.15 times ten thousand questions across 30 disciplines. Its value lies not only in increasing the number of questions, but also in introducing information formats such as charts and structural diagrams. If an evaluation system first converts images into text using another model, the score measures the entire processing chain; if images are supplied directly, image resolution, cropping, and input method need to be recorded.[3] MMMU: A Massive Multi-discipline Multimodal Understandi
4. Sample size determines how precise conclusions can be
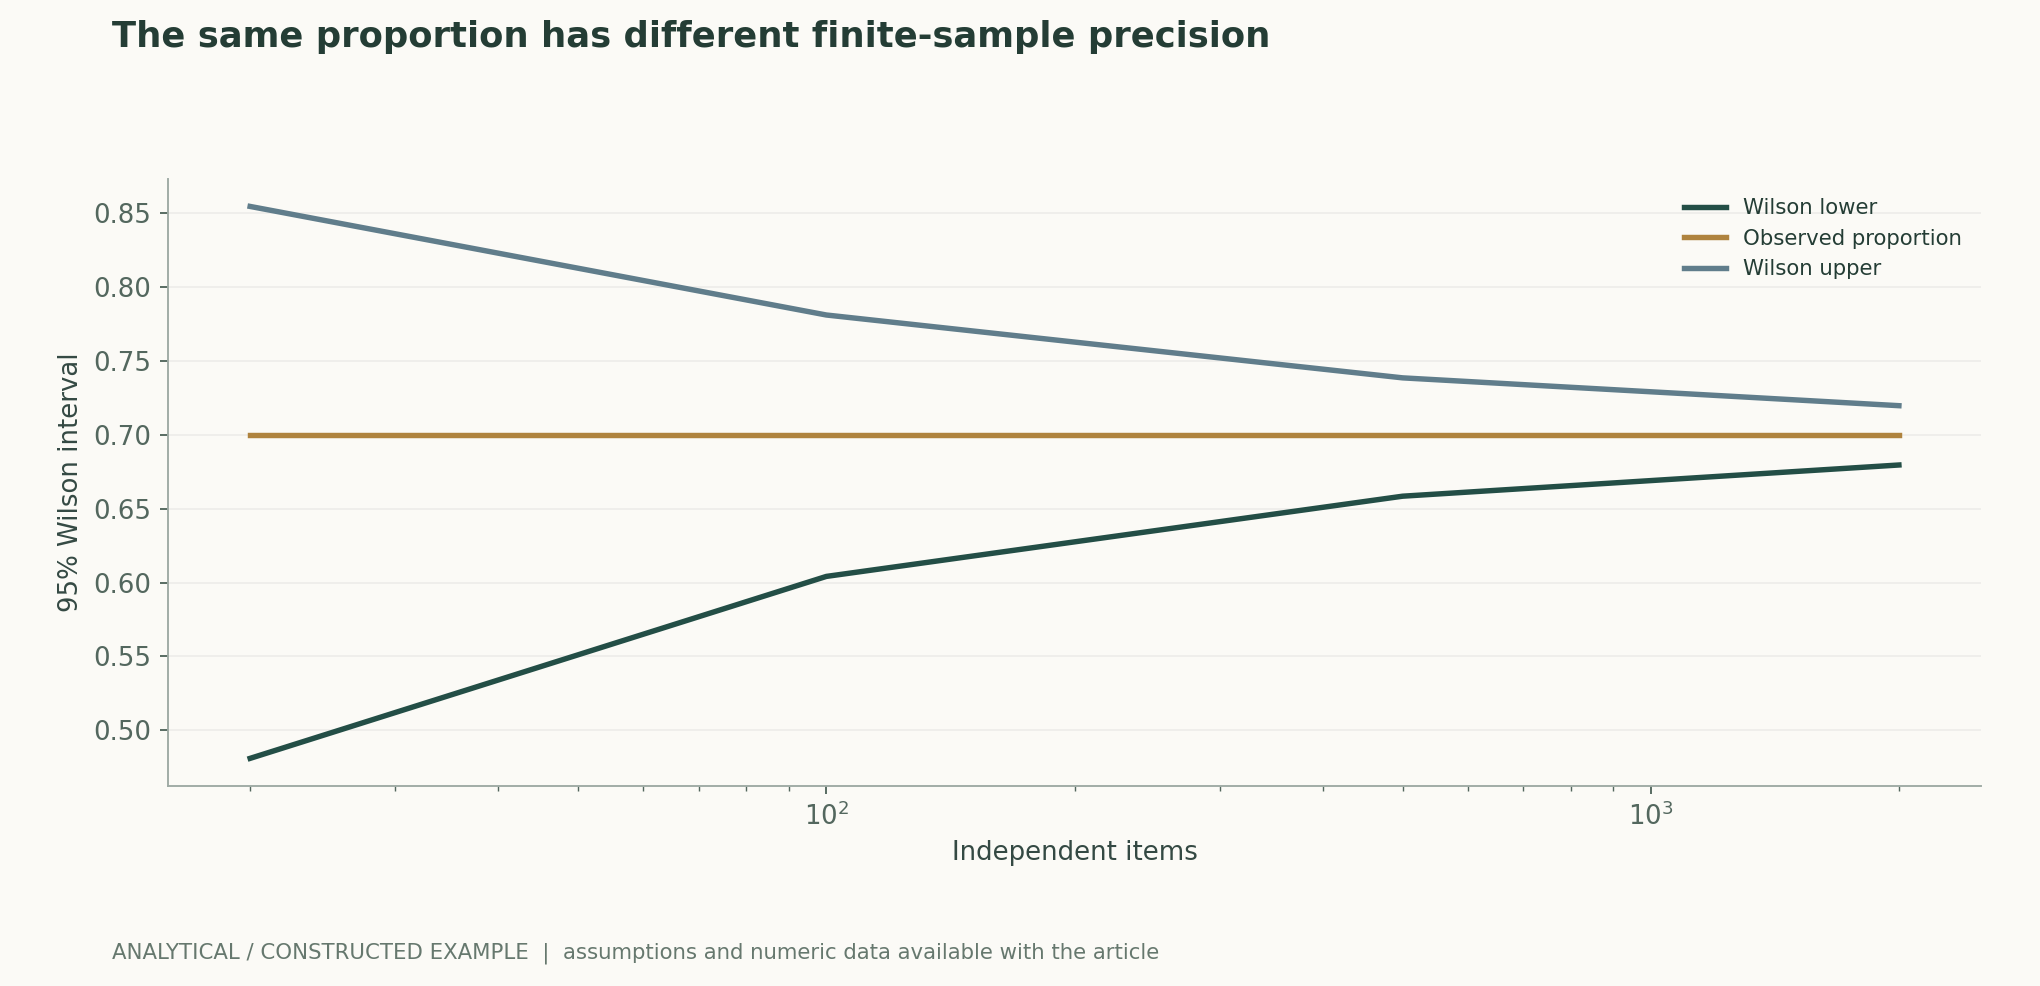
Figure 2 in this edition fixes the observed proportion at 70%, uses n=20, 100, 500, and 2000, and calculates 95% Wilson intervals to explain the relationship between sample size and interval width; the values do not come from any model. The intervals depend on independent binomial observations; multiple questions from the same document, repeated users, or shared templates may reduce the effective sample size. Resampling or stratified estimation should be selected according to the actual correlation structure, rather than simply treating the number of questions as the number of independent pieces of evidence.作者分析与复核建议 / Author analysis
5. Test contamination requires a traceable timeline
If evaluation questions or answers enter training material, a benchmark may measure memorization and generalization simultaneously. This review recommends recording the temporal cutoff for data available for training, the release history of the evaluation set, deduplication methods, and potential near-duplicates. The absence of a test set from a known inventory does not justify claiming complete freedom from contamination; nor should a specific model be accused of data leakage without evidence.作者分析与复核建议 / Author analysis
6. Paired comparisons are more informative than two bars
When comparing two models on the same set of questions, retain correctness outcomes and task categories for each question, and examine the questions on which the models disagree. Reporting two accuracies and their respective intervals separately is insufficient to fully assess uncertainty in the difference. If questions have a hierarchical category structure, corresponding stratified or paired methods can be used; if the most favorable settings are repeatedly selected, the selection process should be disclosed. This review does not calculate statistical significance for any real model.作者分析与复核建议 / Author analysis
7. What reproducibility records should contain
At a minimum, preserve the question version, prompt templates, few-shot examples, decoding parameters, tool permissions, model identifier, execution time, failure and retry rules, and scorer version. Reproducibility conditions differ between open-weight models and online services; a service may be updated under the same product name. A recording protocol can help determine subsequently whether changes arise from the model, system components, or scoring conditions.作者分析与复核建议 / Author analysis
An average needs explicitly defined weights
Averaging all questions with equal weight may produce a different result from first calculating a score for each discipline and then averaging disciplines with equal weight. The former gives greater weight to disciplines with more questions, while the latter emphasizes balance across domains; both methods must be explicitly defined and disclosed. If the intended users handle only a small subset of the tasks, results matching their actual task distribution should also be reported. This review does not prescribe weights suitable for every use, nor does it infer that missing disciplines have been covered.作者分析与复核建议 / Author analysis
8. A point estimate of accuracy needs an error range
If n independent samples share the same probability of success, the standard error of sample accuracy is approximately sqrt[p(1−p)/n]. However, with small samples or values close to 0 or 1, a simple normal interval may be unstable, and the Wilson interval is generally more appropriate for displaying finite-sample uncertainty. It still depends on the sampling model; when questions from the same document or variants of the same question form clusters, each variant cannot be treated as an independent sample. Resampling should follow the sampling unit, and reports should specify whether the interval captures question sampling, model randomness, or annotation error.[2] Holistic Evaluation of Language Models[1] Measuring Massive Multitask Language Understanding
9. Comparing models on the same question set is a paired problem
If two models answer the same set of questions, the correspondence for each question should be retained when comparing their difference. Error formulas for two independent samples ignore this correlation structure and may overstate or understate uncertainty. One can report a cross-tabulation of “only A correct, only B correct, both correct, both incorrect,” or perform a paired bootstrap over questions or document clusters. Repeatedly trying multiple prompts and reporting only the best also introduces selection bias; the prompt-search budget must be included in the experimental description.[2] Holistic Evaluation of Language Models[3] MMMU: A Massive Multi-discipline Multimodal Understandi
10. Task weights can dominate the overall score
Let the score for each domain be s_j and the overall score be the weighted average using domain weights w_j. A model ranking higher under one set of weights is not guaranteed to remain higher under another distribution of user needs. Multimodal evaluation also needs to distinguish errors in image understanding, text reading, knowledge, and reasoning, rather than labeling all failures as inadequate visual capability. In addition to the preregistered overall score, domain scores, weights, missing items, and worst-subgroup performance should be disclosed so that users can reaggregate results according to their actual tasks.[1] Measuring Massive Multitask Language Understanding[2] Holistic Evaluation of Language Models[3] MMMU: A Massive Multi-discipline Multimodal Understandi
11. Contamination and deduplication belong on the evaluation checklist
If evaluation samples or near-variants enter training, retrieval, or prompt examples, scores may mix memorization with generalization. Checking only exact strings does not capture semantic paraphrases, but overly broad similarity filtering may also remove genuinely needed domain knowledge. We recommend recording data dates, sources, and exact and approximate deduplication rules, and cross-validating with newly constructed, human-reviewed question sets. Constructing a contamination mixture model can explain why scores rise, but this figure cannot be used to infer the contamination proportion of any particular real-world model.[4] Deduplicating Training Data Makes Language Models Bette[5] Documenting Large Webtext Corpora: A Case Study on the
Core formulas and derivations
(1) c is the number of successes. The independent and identically distributed assumption does not apply to every question set; p=0.7 in the figure is merely an analytical setting.
LaTeX
\widehat p=\frac{c}{n},\qquad \mathrm{SE}(\widehat p)\approx\sqrt{\widehat p(1-\widehat p)/n}(2) Taking z as a standard normal quantile yields the corresponding approximate confidence interval. The sampling unit should be specified, and the interval should not be treated as a guarantee of performance on all future tasks.
LaTeX
\mathrm{CI}_{\rm Wilson}=\frac{\widehat p+\frac{z^2}{2n}\ \pm\ z\sqrt{\frac{\widehat p(1-\widehat p)}{n}+\frac{z^2}{4n^2}}}{1+\frac{z^2}{n}}(3) Task weights are part of the evaluation design. How missing tasks are handled and whether weights are renormalized should be fixed and disclosed before comparison.
LaTeX
S=\sum_jw_js_j,\quad \sum_jw_j=1,\quad w_j\ge0Method and evidence workflow
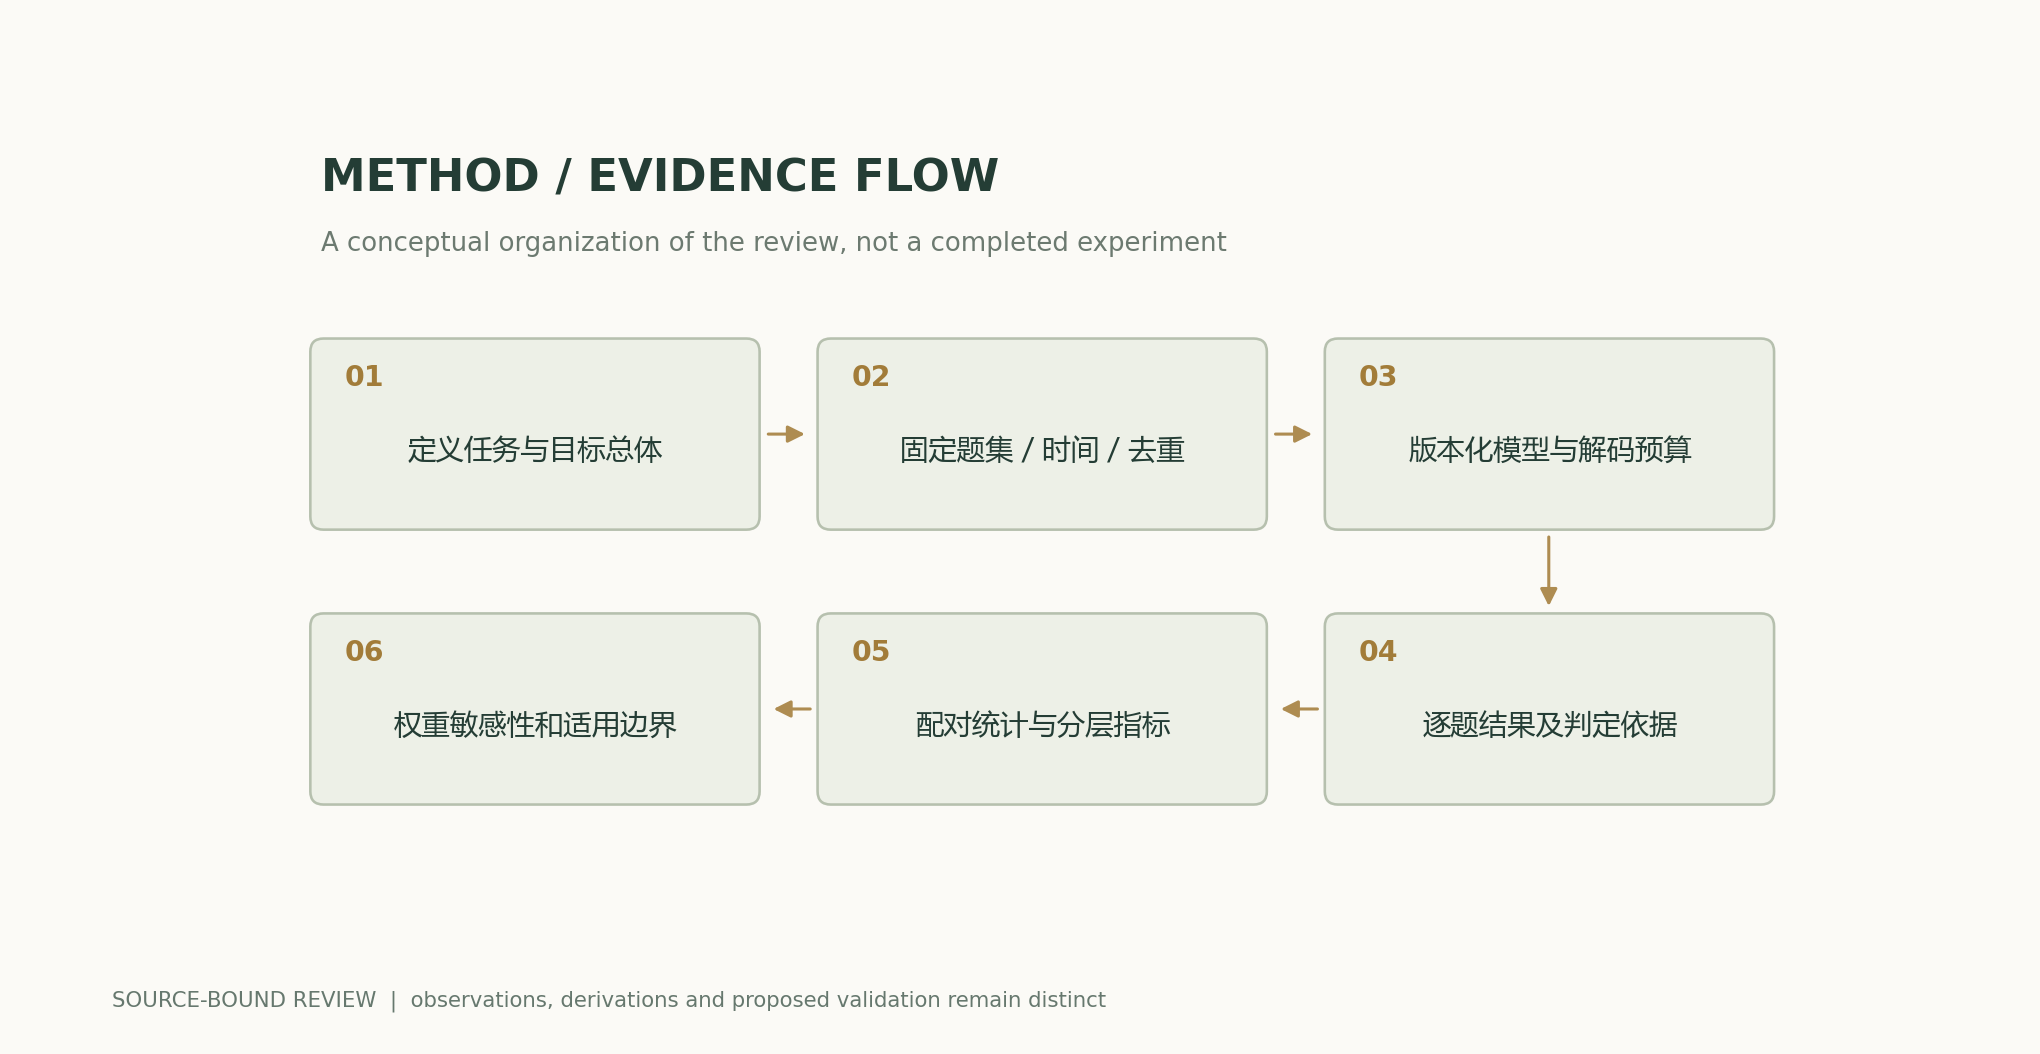
Analytical figures and numerical examples
Recalculable worked example
When the observed proportion is 0.7 in both cases, the Wilson interval for n=20 is approximately [0.481,0.855], and for n=500 approximately [0.658,0.739]. Correlated questions make this independence model overly optimistic.
Comparison of methods
| Method or judgment | Controlled variables and measurement | Failure conditions and interpretation |
|---|---|---|
| Single overall score | Fix task weights and also report component scores and the worst subgroup | Aggregation may conceal local failures or change rankings |
| Question accuracy | Specify the sampling unit and interval calculation method | Correlated questions cannot serve as independent samples |
| Model difference on the same question set | Retain a paired table or resample by document cluster | The independent two-sample formula may not apply |
| Contamination detection | Temporal splitting, exact/approximate deduplication, and cross-validation with new questions | The absence of string overlap cannot prove the absence of training exposure |
Verification and experimental plan
- Fix the model version, evaluation code, task set, scoring rules, aggregation weights, and prompt-search budget in advance.
- Save each question's output, grounds for judgment, random seed, and failure type; saving only the overall score is insufficient.
- Define sampling units by original document or question family, provide intervals, and conduct sensitivity analyses under different sampling assumptions.
- Preserve same-question correspondence when comparing models, and publish a cross-tabulation of differences or a rerunnable paired-resampling procedure.
- Record data sources, dates, and contamination-detection rules, and separate evaluations of original questions, near-variants, and new questions.
- Also report latency, cost, and the proportions of refusals and unjudgeable responses; after changing the scorer, recalculate results for all models, not just the new model.
Scope and limitations
- Statistical intervals depend on sampling and correlation assumptions.
- Annotation disagreements and scorer errors are not automatically eliminated by the number of questions.
- Analytical contamination examples do not diagnose any real-world model.
- No new model leaderboard or capability certification is provided.
Mapping primary sources to claims
- Measuring Massive Multitask Language UnderstandingHendrycks et al. · 2020-09-07v3 abstract; 57-task benchmark
- Holistic Evaluation of Language ModelsLiang et al. · 2022-11-16v2 abstract; seven dimensions and evaluation coverage
- MMMU: A Massive Multi-discipline Multimodal Understanding and Reasoning Benchmark for Expert AGIYue et al. · 2023-11-27v4 abstract; dataset scope
- Deduplicating Training Data Makes Language Models Better, , , , , , · 2021-07-14Abstract; 原文方法、理论和实验章节见作者原始论文链接
- Documenting Large Webtext Corpora: A Case Study on the Colossal Clean Crawled Corpus, , , , , , , · 2021-04-18Abstract; 原文方法、理论和实验章节见作者原始论文链接
Citation and article export
BibTeXRISCSL JSONTXTArticle JSON
Author, version, and sources
AI-assisted research review; Codex (AI) wrote the review and performed analytical derivations based on the listed primary literature. This site has no record of independent peer review or original model experiments for this article.
Reader performance revision: a previously read page is also reused when a recent HEAD response returns 200 and the ETag is unchanged. The article text, formulas, sources, and scientific-figure data retain the content of the previous version.
The conceptual cover and scientific diagrams are kept separate; scientific figures are calculated from publicly available formulas and explicit assumptions, and all results from original papers are attributed.
Author, version, and correction history · /guides/evaluation-beyond-leaderboards/v5/
Sources for the cover and scientific figures · Data, sources, and assumptions · Publication and version history
Source revision: 6251a250b27bb8b449f59b392f81abd355383770