
Abstract
Mitochondrial heteroplasmy is a population variable inside a population of cells. This analysis separates intracellular drift, organelle-level selection and cell-level selection, then shows how sequencing depth adds a second sampling process. A small effective bottleneck and strong read noise can produce superficially similar observations; resolving them requires biological replication across lineages.
A nested population problem
A heteroplasmy fraction describes the share of mitochondrial genomes carrying a specified variant. It does not directly describe the fraction of affected cells, respiratory capacity or organismal disease. Two tissues with the same mean can differ greatly in the distribution among cells. A small number of highly enriched cells and a uniform intermediate fraction have different biological implications. The relevant scale must be declared before comparing measurements.
Three distinct windows on the process
The human primordial-germ-cell study by Floros and colleagues examined developmental changes in mitochondrial genetic diversity. Lieber and colleagues investigated mitochondrial fragmentation and selective removal of detrimental genomes in the Drosophila germline. Lareau and colleagues combined mitochondrial genotyping with single-cell chromatin accessibility. These approaches interrogate developmental selection, a candidate mechanism and lineage-associated measurement, respectively; none makes their observables interchangeable. [1], [2], [3]
Effective size is not a physical count
A bottleneck model represents genetic sampling with an effective number of segregating units. That number need not equal the number of mitochondrial DNA molecules counted in a cell. Correlated replication, packaging and unequal transmission can reduce effective independence. Inferring a bottleneck from variance therefore requires assumptions about the transmission process. Reporting an effective size as a directly counted organelle number would conceal those assumptions and suggest more anatomical precision than the measurement provides.
Selection has several possible levels
A genome can become more common because it replicates faster, because its organelle survives more often, or because its host cell expands. These routes can oppose one another. A variant with an intracellular advantage may reduce cell fitness. A tissue-level increase does not identify the winning level of selection. Longitudinal lineage information is useful precisely because it can separate changing composition within cells from replacement of cells.
Sequencing creates another bottleneck
Read counts sample molecules that have already passed through extraction and library preparation. Under an ideal independent-read model, uncertainty decreases with depth, but duplicate molecules violate that independence. Increasing sequencing reads without increasing unique molecules can make a confidence interval look better without adding equivalent information. Variant-specific mapping errors also fail to average away. Calibration should include molecular complexity and error controls, rather than treating nominal depth as the sole measure of evidence.
The mean can hide functional tails
A hypothetical tissue with half its cells near zero heteroplasmy and half near one has the same mean as a tissue whose cells are all near one half. Any nonlinear cellular response distinguishes these populations. This is a direct consequence of aggregation, not evidence for a universal pathogenic threshold. Functional assays and cell-state measurements should be linked to genotype at an appropriate resolution before a mean fraction is assigned a physiological interpretation.
Developmental and acquired changes differ
Sampling an embryo at successive stages and sampling an adult tissue at successive ages do not observe the same process. Lineage survival, tissue remodeling and technical accessibility change the sampled population. Apparent purifying selection could partly reflect loss of a cell class from the sampling frame. A rigorous analysis therefore keeps cell identity, stage and genotype linked, and evaluates whether the same developmental compartments are being compared.
An informative null result
If within-lineage fractions remain stable while bulk heteroplasmy changes, a cell-composition explanation gains support. If fractions change within persistent lineages, intracellular dynamics become more plausible. Neither observation uniquely establishes a molecular mechanism, but the distinction eliminates a major ambiguity. The most useful experiment combines lineage continuity, independent molecule counts and a functional readout, instead of collecting a larger number of unrelated tissue averages.
Sequencing depth and biological copies are different denominators
More reads can reduce uncertainty about a DNA sample without increasing the number of independent mitochondrial genomes that founded the sampled lineage. If all reads descend from a few original templates, a binomial read model understates uncertainty. A hierarchical analysis would distinguish founding genomes, cells, sampled molecules and sequencing reads. The effective bottleneck should be inferred from variation across independent lineages or cells, with a measurement-error component estimated separately. A narrow read-count interval is compatible with a broad biological distribution. This distinction matters most when comparing tissues with different clonal structures or comparing a bulk average with a single-cell distribution.
Selection and drift need a time axis
An increase in mean heteroplasmy is consistent with selection, but biased sampling of surviving lineages can also shift the mean. Drift primarily changes the distribution under the neutral model, while selection changes expected frequencies conditional on the starting state. A proposed longitudinal design would stratify by initial heteroplasmy, retain lineage identifiers and record missing or lost lineages. The joint pattern of mean change, variance growth and survival would be compared with explicit alternatives. Without those observations, a fitted selection coefficient can absorb an incorrect effective population size or unmodeled cell turnover. The coefficient should therefore be reported with its model and sampling assumptions.
A model that can be challenged
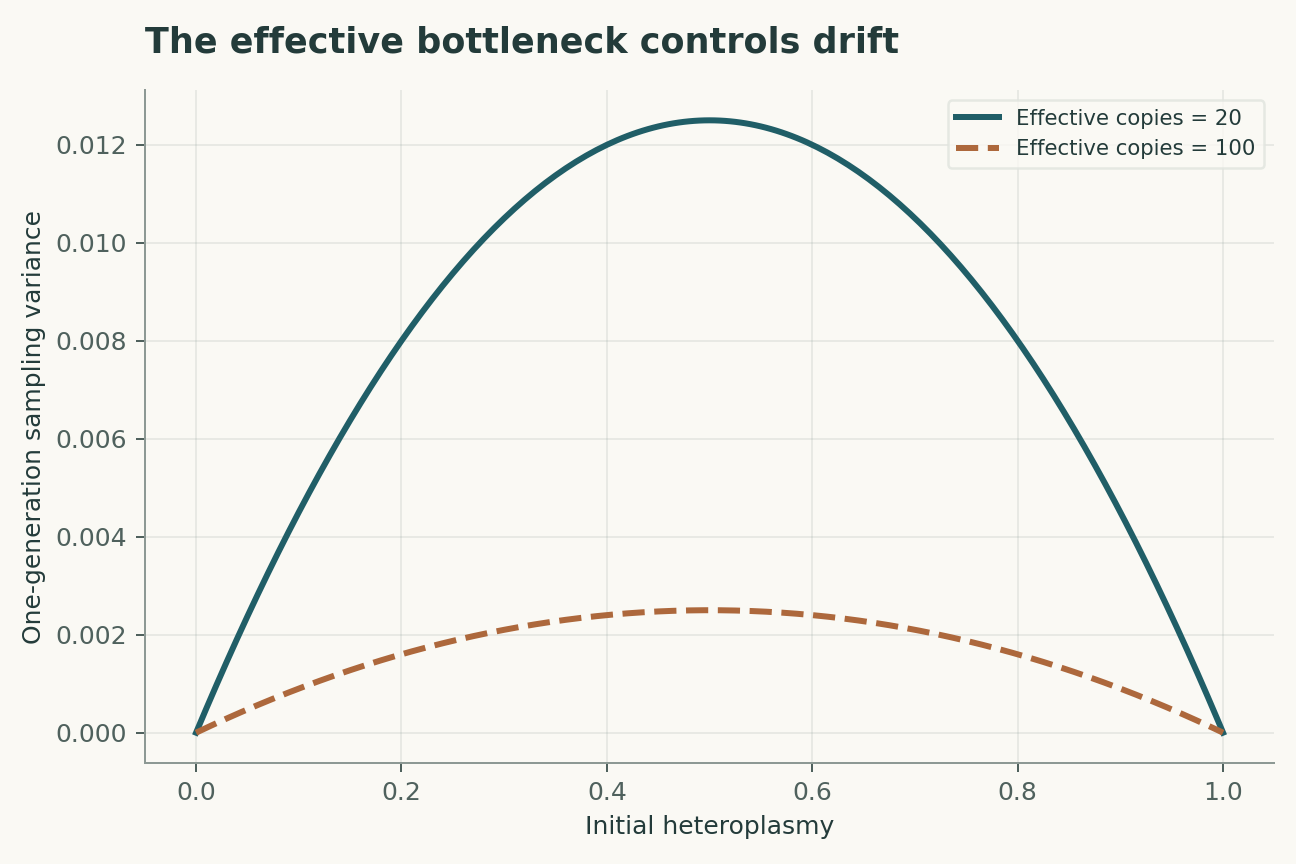
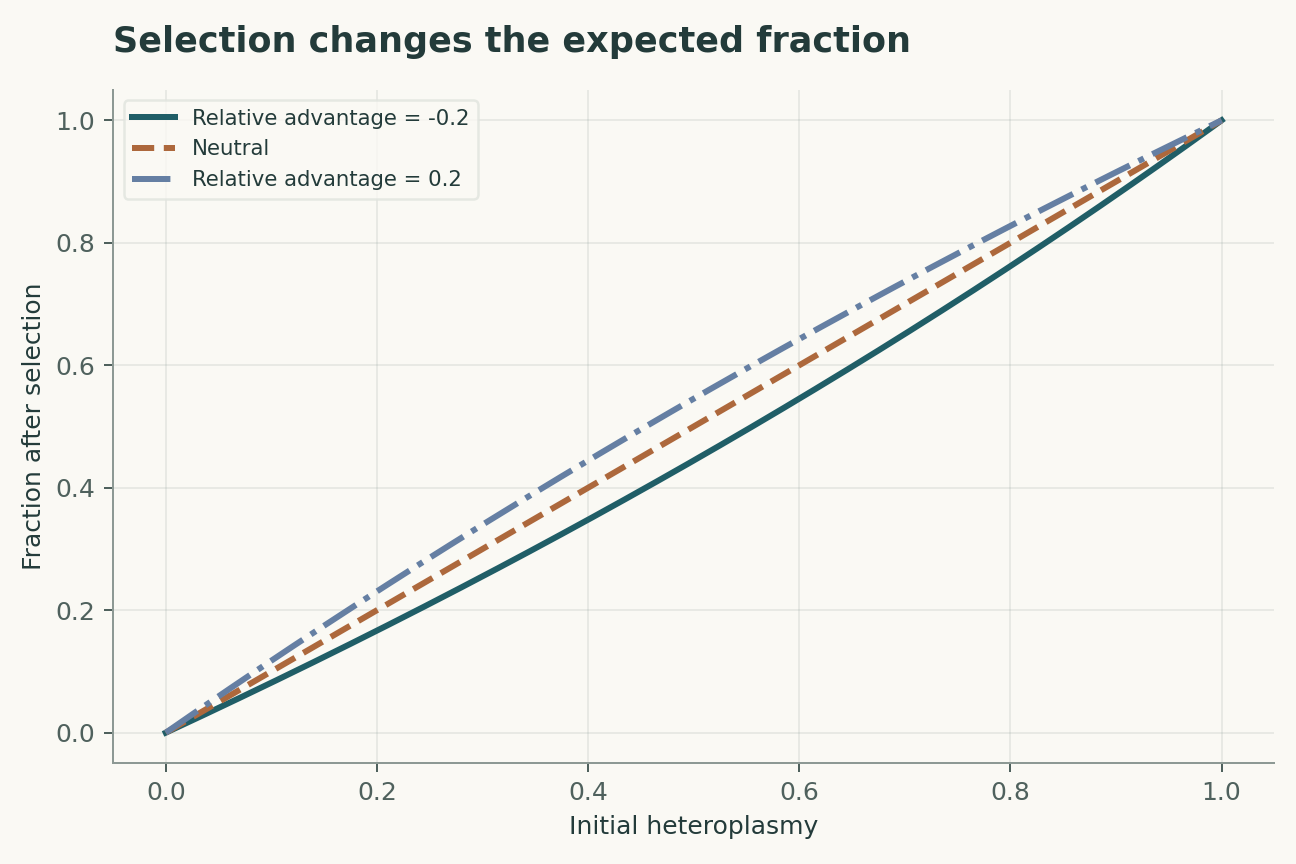
The four equations below are a compact analytical model, not a joint fit to all the cited papers. Their interpretation is as follows. For one ideal binomial transmission step, h is parental fraction and N_e is the effective number of independently sampled units. A relative replication advantage s changes the fraction after one simplified selection step; this is not a tissue-fitness law. K variant reads out of n independent error-free reads form an observation model, distinct from biological transmission. Across cells with equal independent-read depth, total observed variance contains biological and read-sampling components.
The observational target is the distribution of heteroplasmy among identified cells. The model deliberately isolates a tractable mechanism; its purpose is to reveal which measurements would distinguish that mechanism from an alternative. Parameter values in the figures are declared illustrative inputs. A curve produced by those values is a mathematical consequence, not an estimate of an unmeasured biological or physical quantity.
A discriminating validation design
The primary comparison should test within-lineage change versus replacement of lineages. The unit of independent replication is independently sampled lineage; repeated readings from the same unit improve precision but do not create independent replication. A strong validation would hold out new tissue compartments before choosing thresholds or fitting nuisance corrections. In particular, unequal molecule sampling and changing cell composition must be measured, constrained or varied in a sensitivity analysis. Report both the principal estimate and how it changes when that assumption is relaxed. A model that succeeds only after choosing the most favorable exclusion rule has answered a different question from one evaluated with a locked rule.
Worked numerical analysis
At h = 0.2, a one-step effective size of 20 gives variance 0.008, whereas 100 gives 0.0016. Independent read sampling at depth 100 contributes variance 0.0016 for a fixed h = 0.2. Thus a technical variance can equal the ideal biological variance of a much larger bottleneck. The second panel plots the one-step selection map for s = -0.2, 0 and 0.2. These are dimensionless examples; no value is fitted to a human embryo.
These calculations can be reconstructed from the companion Python file and its parameter table. Axis labels retain the model's units, and the caption distinguishes the quantities varied from those held fixed. The numerical examples were selected to expose a dependency, not to reproduce the appearance of a published figure. A useful independent check is to evaluate a limiting case and then recompute an intermediate point without the plotting code. Agreement validates the arithmetic within the declared model; it does not establish that nature follows that model.
Evidence, transfer and next steps
The scope of the conclusion is limited by unequal molecule sampling and changing cell composition. Transfer to new tissue compartments requires evidence beyond fitting the original observations. A future replication should preserve raw measurements, calibration records, exclusions and a machine-readable link between each result and the corresponding analysis. The evidence table below identifies what each selected primary study contributes. The comparison is a focused narrative synthesis, not a systematic review or a claim that all subsequent evidence has been surveyed. The proposed study has not been performed here. Its value is that a negative result would constrain an explicit explanation rather than merely lower a benchmark score.
A declared analytical model
Four equations, explicit assumptions
(1) For one ideal binomial transmission step, h is parental fraction and N_e is the effective number of independently sampled units.
(2) A relative replication advantage s changes the fraction after one simplified selection step; this is not a tissue-fitness law.
(3) K variant reads out of n independent error-free reads form an observation model, distinct from biological transmission.
(4) Across cells with equal independent-read depth, total observed variance contains biological and read-sampling components.
Constructed examples · Reproducible data
Inspect the quantitative argument
These curves are calculated from the declared models. They are not observations from the cited studies. Every figure includes its numeric data and vector version.


Which evidence answers which question?
| Evidence or design choice | What it identifies | What remains unresolved |
|---|---|---|
| Source 1 | Human developmental observations reveal changing mitochondrial genetic diversity. | Developmental sampling does not directly count effective segregating units. |
| Source 2 | Drosophila experiments connect fragmentation with selective genome removal. | Mechanism and organism are specific to the study. |
| Source 3 | Single-cell mitochondrial genotyping can be paired with chromatin state. | Coverage and ascertainment limit detectable variants. |
| Primary observable | the distribution of heteroplasmy among identified cells | unequal molecule sampling and changing cell composition |
| Independent test | within-lineage change versus replacement of lineages | Requires new measurements |
| Transfer set | new tissue compartments | Not validated by the constructed numerical example |
A proposed validation protocol
This is a proposed evaluation design. No new biological experiment, clinical trial or physical experiment was carried out for this article.
- Specify the distribution of heteroplasmy among identified cells before fitting.
- Retain independent identifiers for each independently sampled lineage.
- Separate new tissue compartments from model development.
- Measure or bound unequal molecule sampling and changing cell composition.
- Record units, calibration and the observation operator.
- Compare the primary model with a named rival explanation.
- Prespecify the test: within-lineage change versus replacement of lineages.
- Archive raw data, exclusions, parameter files and executable analysis.
What the primary sources establish
Vasileios I. Floros, Angela Pyle, Sabine Dietmann et al. · 2018 [1]
Contribution. Human developmental observations reveal changing mitochondrial genetic diversity.
Boundary. Developmental sampling does not directly count effective segregating units.
Source locator. Abstract / selected primary-source sections; see linked bibliographic record.
Toby Lieber, Swathi P. Jeedigunta, Jonathan M. Palozzi et al. · 2019 [2]
Contribution. Drosophila experiments connect fragmentation with selective genome removal.
Boundary. Mechanism and organism are specific to the study.
Source locator. Abstract / selected primary-source sections; see linked bibliographic record.
Caleb A. Lareau, Leif S. Ludwig, Christoph Muus et al. · 2020 [3]
Contribution. Single-cell mitochondrial genotyping can be paired with chromatin state.
Boundary. Coverage and ascertainment limit detectable variants.
Source locator. Abstract / selected primary-source sections; see linked bibliographic record.
Limits of this analysis
- Developmental sampling does not directly count effective segregating units.
- Mechanism and organism are specific to the study.
- Coverage and ascertainment limit detectable variants.
- Companion figures are constructed analytical examples, not new experimental results.
- Transfer to new tissue compartments has not been demonstrated by this review.
A focused narrative analysis of the named primary studies, not a systematic literature search or a claim to comprehensive coverage through 2026.
Questions that would change the conclusion
- How much variation arises within versus between persistent lineages?
- Which measurements constrain effective independence of segregating genomes?
- When does a bulk mean fail to predict the functional tail?
References
- Vasileios I. Floros, Angela Pyle, Sabine Dietmann et al.. Segregation of mitochondrial DNA heteroplasmy through a developmental genetic bottleneck in human embryos. Nature Cell Biology (2018). 10.1038/s41556-017-0017-8.
- Toby Lieber, Swathi P. Jeedigunta, Jonathan M. Palozzi et al.. Mitochondrial fragmentation drives selective removal of deleterious mtDNA in the germline. Nature (2019). 10.1038/s41586-019-1213-4.
- Caleb A. Lareau, Leif S. Ludwig, Christoph Muus et al.. Massively parallel single-cell mitochondrial DNA genotyping and chromatin profiling. Nature Biotechnology (2020). 10.1038/s41587-020-0645-6.
Bibliographic identity checked against Crossref. Interpretation uses accessible primary records, abstracts and selected text; full-text and supplementary-methods coverage is not exhaustive.
Authorship and provenance
Source-based research review and original mathematical analysis written by Codex (AI). Cited experiments belong to the cited research teams.
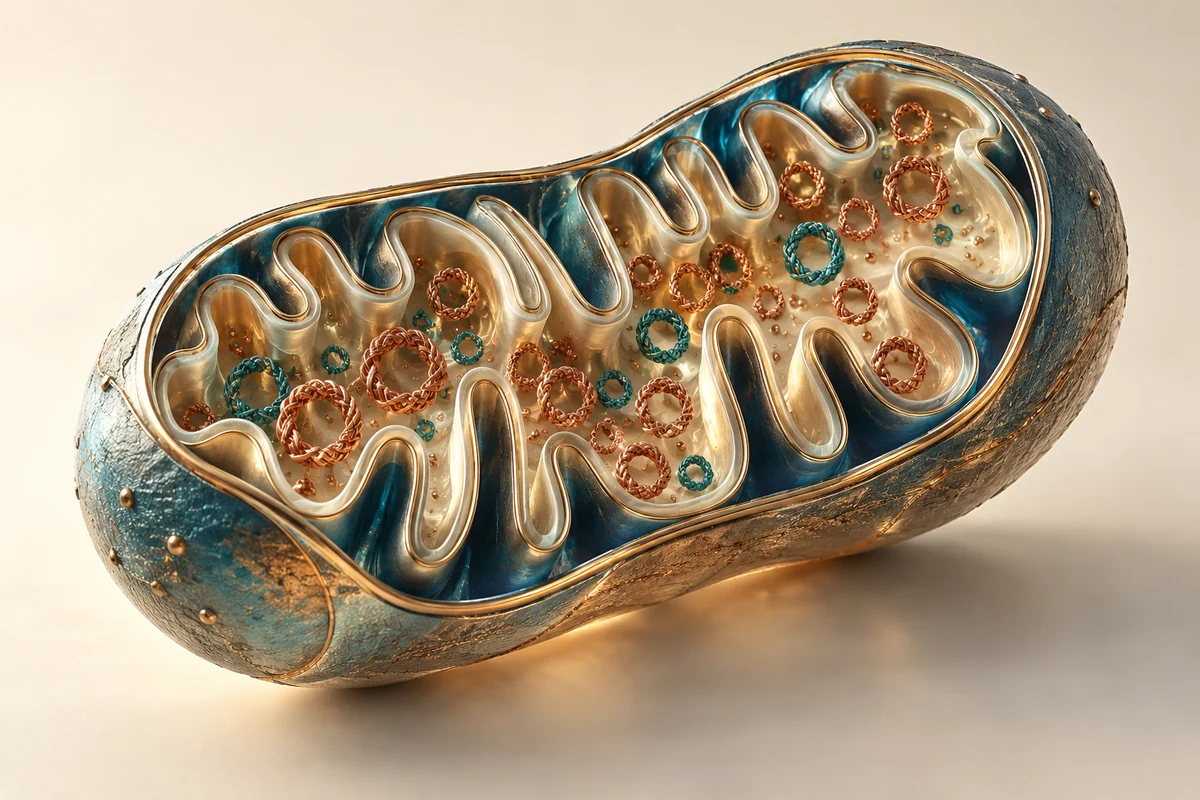
Concept cover created with the built-in ImageGen tool. Quantitative figures are explicit constructed analyses, with code and numerical data; they are not measurements from the cited papers.
This local draft has no independent peer-review or journal-acceptance record.