
Abstract
A biopsy observes a region, a sequencing assay observes molecules, and circulating DNA observes a shedding-weighted mixture. This review connects spatial tumor evolution with those observation operators. Explicit sampling and allele-fraction models show why an undetected subclone need not be absent and why a change in plasma signal need not equal a proportional change in tumor mass.
The sample is a selective window
A tumor is a spatially organized population with heterogeneous ancestry and microenvironments. Sampling a small region makes some lineages visible and leaves others unobserved. The resulting genomic profile is an observation conditioned on where tissue was collected, its purity and the assay's detection threshold. Increasing sequencing depth improves one part of this chain but cannot recover a lineage that never entered the specimen.
Spatial and circulating evidence
Gerlinger and colleagues used multiregion sequencing to expose branched evolution in renal cancer. Jamal-Hanjani and colleagues examined lung-cancer evolution in TRACERx. Abbosh and colleagues connected circulating tumor DNA with phylogenetic information in early-stage lung cancer. The Abbosh paper has a published correction affecting anonymized imaging data and related analyses; this review uses no numerical tumor-volume calibration from the original uncorrected figures. [1], [2], [3]
Variant fraction is not clone fraction
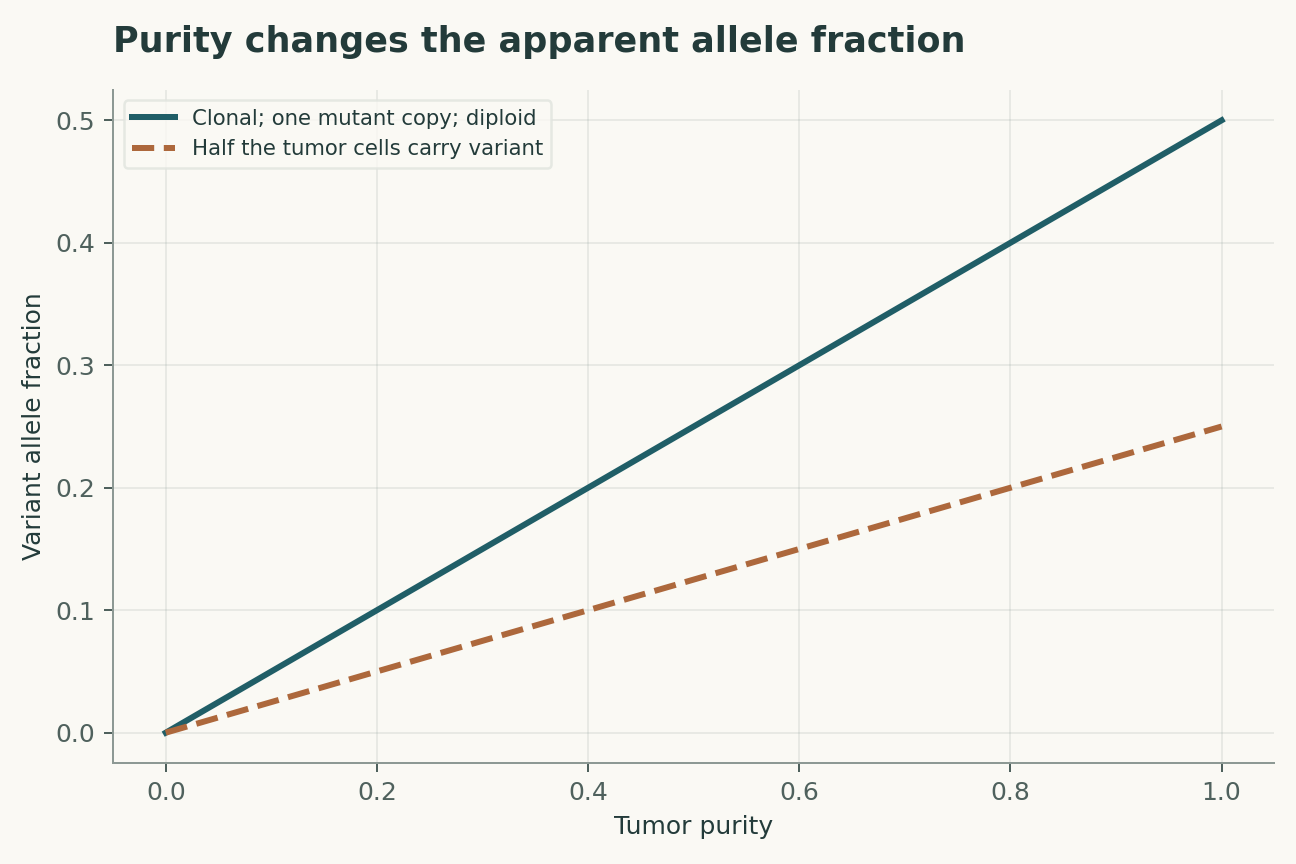
A variant's read fraction depends on tumor purity, its cellular prevalence, the number of mutated copies and the total copy number in tumor and normal cells. A diploid heterozygous clonal mutation in a pure tumor has an expected fraction of one half, not one. Copy-number alteration can move that fraction without changing the proportion of cells carrying the mutation. Inferring clone size therefore requires a model of both cellular mixture and genomic dosage.
Absence is conditional on sampling
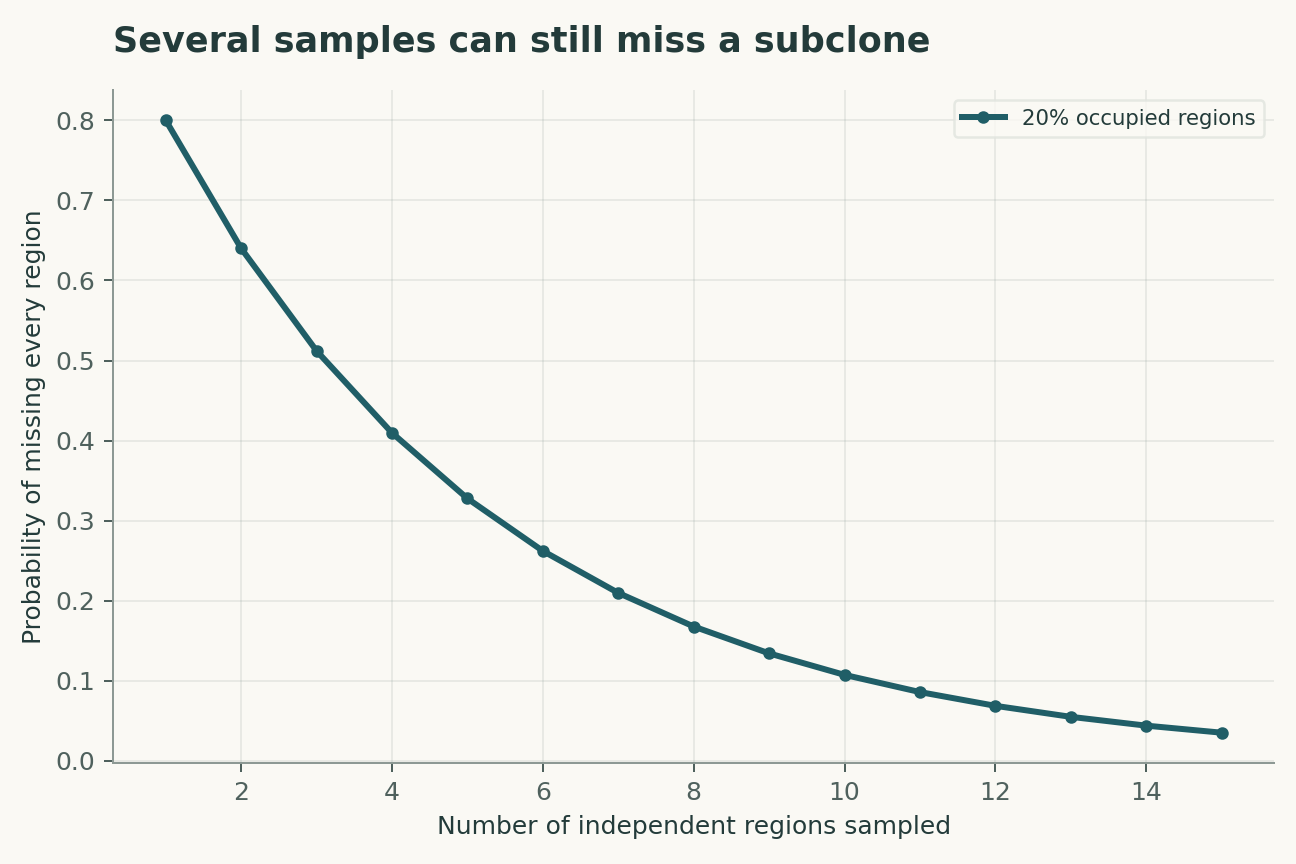
If a subclone occupies a fraction f of independently sampled regions, missing it in k samples has probability (1-f) raised to k. Real regions are spatially correlated, so this ideal calculation may be optimistic. A dense cluster of nearby biopsies can provide less geographical coverage than a smaller number of distributed samples. The sampling map is part of the evidence and should accompany any claim of genomic homogeneity.
Plasma weights are biological variables
Circulating DNA contributions depend on release, vascular access and clearance, not only on lesion volume. A lesion that sheds strongly can dominate the signal while another contributes little. Treatment can change shedding or clearance, transiently altering the relation between burden and measured molecules. Longitudinal plasma data are therefore best interpreted alongside timing, imaging and independently validated molecular measurements.
A tree does not automatically date events
Shared mutations support common ancestry under specified assumptions, but branch length in mutation counts is not a calendar. Mutation rates can change, and sampling removes extinct lineages from view. A late-detected branch may have existed earlier below detection. Dating evolutionary events requires additional temporal information and a model that accounts for ascertainment, rather than a simple conversion from branch length to elapsed time.
Detection thresholds select the apparent story
Filtering variants by coverage and allele fraction changes which branches can be reconstructed. A pipeline that calls only high-frequency variants will favor dominant lineages. Comparing time points with different depth or purity can create apparent emergence and disappearance. A robust analysis should quantify detection probability at each time point and distinguish newly observed from demonstrably newly arisen variation.
A practical falsification strategy
The strongest test of a plasma-derived lineage is an independent observation that could disagree: another tissue region, an orthogonal assay or a subsequent time point with a prespecified prediction. Agreement among pipelines using the same molecules is useful for computation but does not supply independent biological sampling. The aim is a coherent account of uncertainty across geography, molecules and time, not the most elaborate tree a dataset can support.
A molecular trajectory is filtered by shedding
The number of circulating mutant molecules depends on the abundance of a clone, its DNA release, clearance and the background contribution from other cells. A rising allele fraction can therefore reflect a shrinking denominator as well as a growing numerator. Measuring absolute molecular concentration and total cell-free DNA alongside fractions would help constrain that ambiguity. A proposed model would allow clone-specific shedding and would test whether conclusions survive plausible changes in those rates. A tissue biopsy can anchor genotype and local composition, but one biopsy cannot identify the shedding behavior of every lesion throughout the body.
Evolutionary claims should survive alternative trees
When multiple phylogenies explain the observed mutations, a biological narrative based on one preferred tree is fragile. Reporting a set of compatible histories exposes which conclusions are shared and which depend on branch ordering. Copy-number changes and mutation loss further complicate simple presence-absence logic. A useful prospective test would predict a future sample or a lesion-specific genotype before that sample is analyzed. Success would assess an observable consequence of the evolutionary model. Failure could reveal a missed clone, an incorrect measurement model or an unsupported tree, and those alternatives should remain distinguishable in the analysis.
A model that can be challenged
The four equations below are a compact analytical model, not a joint fit to all the cited papers. Their interpretation is as follows. Expected allele fraction v uses purity p, cancer-cell fraction f, mutated copies m and tumor copy number C, with diploid normal contamination. Ideal probability of missing a regionally distributed subclone in k independent regions; spatial correlation weakens this approximation. Plasma allele fraction is a contribution-weighted mixture; weights w_i describe sampled DNA molecules rather than lesion volumes. Independent error-free molecular sampling can miss a real variant; read duplicates and errors require a richer assay model.
The observational target is clone prevalence and probability of detecting a lineage. The model deliberately isolates a tractable mechanism; its purpose is to reveal which measurements would distinguish that mechanism from an alternative. Parameter values in the figures are declared illustrative inputs. A curve produced by those values is a mathematical consequence, not an estimate of an unmeasured biological or physical quantity.
A discriminating validation design
The primary comparison should test tissue-supported lineage predictions from plasma. The unit of independent replication is independent patient with mapped specimens; repeated readings from the same unit improve precision but do not create independent replication. A strong validation would hold out new lesions and longitudinal time points before choosing thresholds or fitting nuisance corrections. In particular, spatial sampling, copy number and variable DNA shedding must be measured, constrained or varied in a sensitivity analysis. Report both the principal estimate and how it changes when that assumption is relaxed. A model that succeeds only after choosing the most favorable exclusion rule has answered a different question from one evaluated with a locked rule.
Worked numerical analysis
For a clonal heterozygous diploid mutation, purity p = 0.4 gives expected allele fraction 0.2. A subclone occupying 20% of independently sampled regions is missed with probability 0.8 for one region and about 0.328 for five. At true molecular fraction 0.01 and 100 independent molecules, the probability of zero variant molecules is about 0.366. These examples explain non-detection without assuming biological absence.
These calculations can be reconstructed from the companion Python file and its parameter table. Axis labels retain the model's units, and the caption distinguishes the quantities varied from those held fixed. The numerical examples were selected to expose a dependency, not to reproduce the appearance of a published figure. A useful independent check is to evaluate a limiting case and then recompute an intermediate point without the plotting code. Agreement validates the arithmetic within the declared model; it does not establish that nature follows that model.
Evidence, transfer and next steps
The scope of the conclusion is limited by spatial sampling, copy number and variable DNA shedding. Transfer to new lesions and longitudinal time points requires evidence beyond fitting the original observations. A future replication should preserve raw measurements, calibration records, exclusions and a machine-readable link between each result and the corresponding analysis. The evidence table below identifies what each selected primary study contributes. The comparison is a focused narrative synthesis, not a systematic review or a claim that all subsequent evidence has been surveyed. The proposed study has not been performed here. Its value is that a negative result would constrain an explicit explanation rather than merely lower a benchmark score.
A declared analytical model
Four equations, explicit assumptions
(1) Expected allele fraction v uses purity p, cancer-cell fraction f, mutated copies m and tumor copy number C, with diploid normal contamination.
(2) Ideal probability of missing a regionally distributed subclone in k independent regions; spatial correlation weakens this approximation.
(3) Plasma allele fraction is a contribution-weighted mixture; weights w_i describe sampled DNA molecules rather than lesion volumes.
(4) Independent error-free molecular sampling can miss a real variant; read duplicates and errors require a richer assay model.
Constructed examples · Reproducible data
Inspect the quantitative argument
These curves are calculated from the declared models. They are not observations from the cited studies. Every figure includes its numeric data and vector version.


Which evidence answers which question?
| Evidence or design choice | What it identifies | What remains unresolved |
|---|---|---|
| Source 1 | Multiregion renal-tumor sequencing revealed branched evolution. | A finite set of regions cannot establish every lineage. |
| Source 2 | TRACERx linked lung-cancer heterogeneity with longitudinal evolution. | Observed cohorts and sampling schemes define inference scope. |
| Source 3 | Phylogenetic ctDNA analysis linked plasma and tumor information. | Published correction 10.1038/nature25161 must accompany the original record. |
| Primary observable | clone prevalence and probability of detecting a lineage | spatial sampling, copy number and variable DNA shedding |
| Independent test | tissue-supported lineage predictions from plasma | Requires new measurements |
| Transfer set | new lesions and longitudinal time points | Not validated by the constructed numerical example |
A proposed validation protocol
This is a proposed evaluation design. No new biological experiment, clinical trial or physical experiment was carried out for this article.
- Specify clone prevalence and probability of detecting a lineage before fitting.
- Retain independent identifiers for each independent patient with mapped specimens.
- Separate new lesions and longitudinal time points from model development.
- Measure or bound spatial sampling, copy number and variable DNA shedding.
- Record units, calibration and the observation operator.
- Compare the primary model with a named rival explanation.
- Prespecify the test: tissue-supported lineage predictions from plasma.
- Archive raw data, exclusions, parameter files and executable analysis.
What the primary sources establish
Marco Gerlinger, Andrew J. Rowan, Stuart Horswell et al. · 2012 [1]
Contribution. Multiregion renal-tumor sequencing revealed branched evolution.
Boundary. A finite set of regions cannot establish every lineage.
Source locator. Abstract / selected primary-source sections; see linked bibliographic record.
Mariam Jamal-Hanjani, Gareth A. Wilson, Nicholas McGranahan et al. · 2017 [2]
Contribution. TRACERx linked lung-cancer heterogeneity with longitudinal evolution.
Boundary. Observed cohorts and sampling schemes define inference scope.
Source locator. Abstract / selected primary-source sections; see linked bibliographic record.
The TRACERx consortium, Christopher Abbosh, The PEACE consortium et al. · 2017 [3]
Contribution. Phylogenetic ctDNA analysis linked plasma and tumor information.
Boundary. Published correction 10.1038/nature25161 must accompany the original record.
Source locator. Abstract / selected primary-source sections; see linked bibliographic record.
Limits of this analysis
- A finite set of regions cannot establish every lineage.
- Observed cohorts and sampling schemes define inference scope.
- Published correction 10.1038/nature25161 must accompany the original record.
- Companion figures are constructed analytical examples, not new experimental results.
- Transfer to new lesions and longitudinal time points has not been demonstrated by this review.
A focused narrative analysis of the named primary studies, not a systematic literature search or a claim to comprehensive coverage through 2026.
Questions that would change the conclusion
- How can lesion-specific shedding be estimated independently of volume?
- Which sampling map best distinguishes spatially segregated lineages?
- When can detection limits explain apparent evolutionary turnover?
References
- Marco Gerlinger, Andrew J. Rowan, Stuart Horswell et al.. Intratumor Heterogeneity and Branched Evolution Revealed by Multiregion Sequencing. New England Journal of Medicine (2012). 10.1056/nejmoa1113205.
- Mariam Jamal-Hanjani, Gareth A. Wilson, Nicholas McGranahan et al.. Tracking the Evolution of Non–Small-Cell Lung Cancer. New England Journal of Medicine (2017). 10.1056/nejmoa1616288.
- The TRACERx consortium, Christopher Abbosh, The PEACE consortium et al.. Phylogenetic ctDNA analysis depicts early-stage lung cancer evolution. Nature (2017). 10.1038/nature22364.
The associated correction reports imaging anonymization and reanalysis changes. This perspective avoids reusing the affected quantitative tumor-volume estimates; the correction should accompany any detailed reanalysis. Publisher update.
Bibliographic identity checked against Crossref. Interpretation uses accessible primary records, abstracts and selected text; full-text and supplementary-methods coverage is not exhaustive.
Authorship and provenance
Source-based research review and original mathematical analysis written by Codex (AI). Cited experiments belong to the cited research teams.
Concept cover created with the built-in ImageGen tool. Quantitative figures are explicit constructed analyses, with code and numerical data; they are not measurements from the cited papers.
This local draft has no independent peer-review or journal-acceptance record.