

Abstract
Pathogen genomes constrain outbreak histories but do not directly reveal who infected whom. Within-host diversity, incomplete sampling and limited temporal signal create multiple transmission histories compatible with one phylogeny. This review develops explicit sampling and clock models, using outbreak sequencing studies to define the boundary between genetic relatedness and epidemiological attribution.
A genealogy is not a contact history
A phylogenetic tree describes ancestry among sampled genetic lineages. A transmission tree describes infection events among hosts. Their nodes and times need not coincide because lineages can coexist within a host and only some pass to another host. Treating these trees as identical can assign unwarranted certainty to a proposed transmission route, especially when many infections were never sampled.
Sequencing and epidemiological inference
Gire and colleagues used genomic surveillance to investigate Ebola-virus emergence and transmission during the West African outbreak. Quick and colleagues demonstrated portable sequencing in an outbreak setting. Didelot and colleagues developed inference for partially sampled and ongoing outbreaks. These contributions concern observational epidemiology and computational reconstruction. None makes genomic similarity alone sufficient evidence of direct transmission between named individuals. [1], [2], [3]
A slow clock can leave many ties
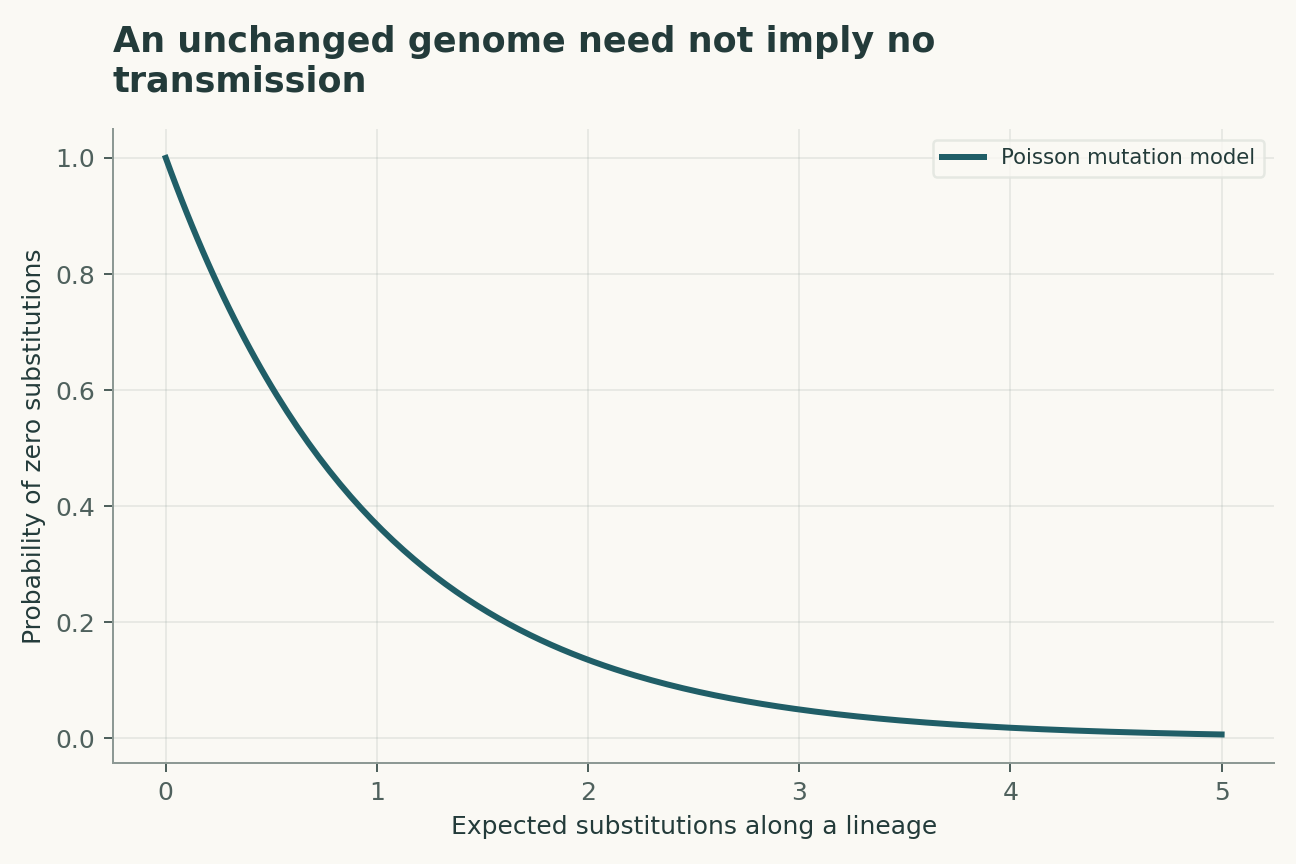
When expected substitutions over an interval are small, several transmission events can occur without a consensus-sequence difference. Identical sequences then support recent relatedness but do not determine the order of hosts. Conversely, sequencing error or within-host diversity can create differences that are not separate transmission steps. The useful temporal resolution depends on the clock, sampling interval and uncertainty in the sequence calls.
Missing hosts create hidden paths
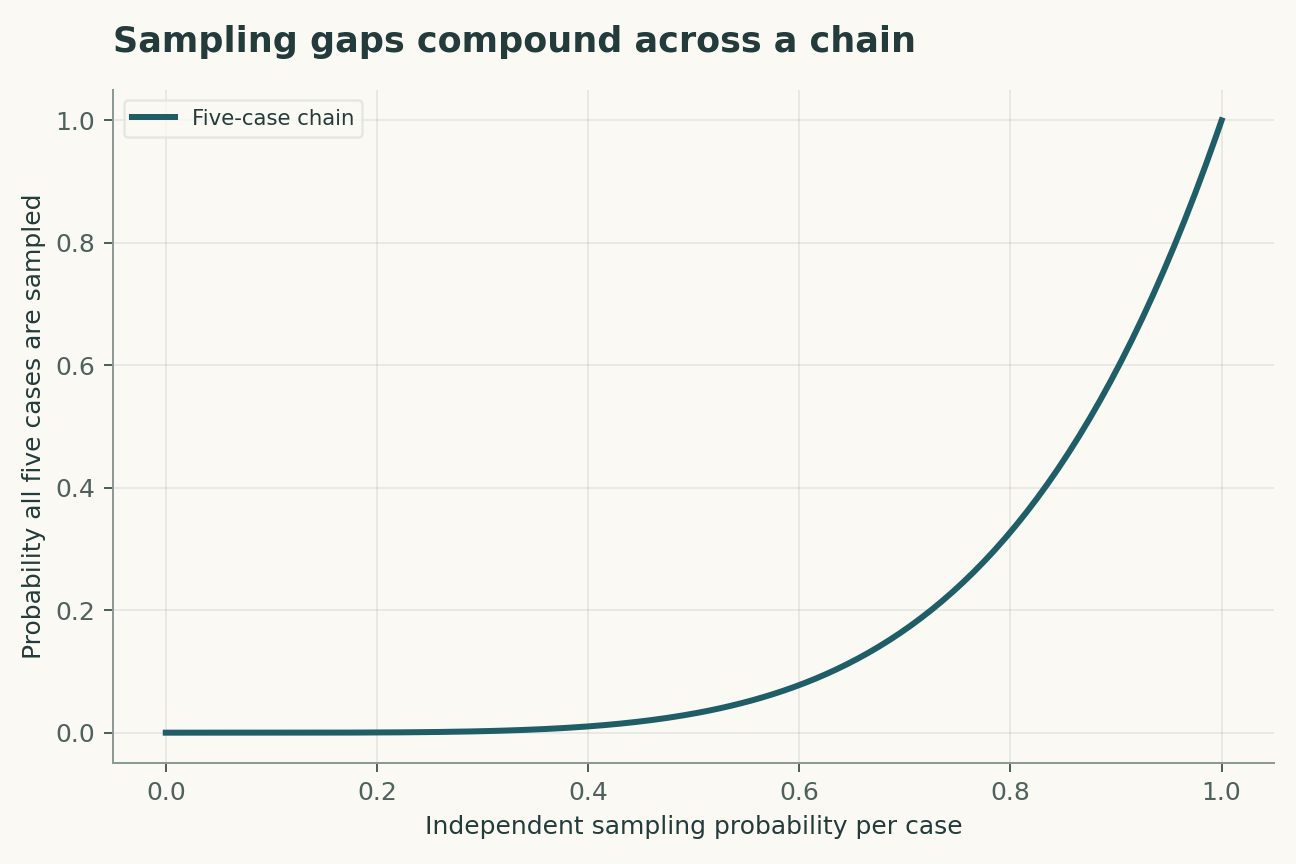
A sampled pair may be linked through one or more unobserved infections. The probability of seeing a complete chain declines quickly when sampling is incomplete. A method that forbids unsampled intermediates can force a direct link even when an indirect path is more plausible. Sampling probability should be represented explicitly and varied when the surveillance system does not support a precise estimate.
Dates provide constraints rather than certainty
Collection dates differ from infection dates, and symptom onset has its own uncertainty. Contact information can exclude some routes while leaving others possible. Combining these data with genomes narrows the set of histories, but errors shared across data sources can remain. A robust reconstruction should retain alternative paths and explain which observations exclude them.
Consensus sequences discard variation
A consensus sequence compresses a within-host population into one representative. Low-frequency variants may contain additional information, but their interpretation depends on reproducible detection and the transmission bottleneck. Shared minor variants can arise through error or recurrent mutation. More sensitive sequencing therefore creates both opportunities and new calibration requirements; it does not automatically resolve directionality.
Geography can enter twice
Spatial proximity may influence both who gets sampled and the prior probability of transmission. If those effects are not separated, a model can appear to discover geographic structure that was partly imposed by surveillance and prior assumptions. Validation should examine how inferred routes change when sampling intensity varies by location, and should distinguish a spatially plausible history from a uniquely identified one.
The appropriate output is an uncertainty set
Operationally useful inference can identify clusters, rule out implausible links and prioritize missing information without producing one definitive chain. Posterior probabilities are conditional on the model and available data, not a certificate of individual responsibility. This review concerns aggregate scientific inference and does not provide pathogen modification, laboratory propagation or sequence-design instructions.
A transmission tree contains unobserved people
A phylogeny relates sampled genomes; a transmission tree relates infection events among hosts. Unsampled infections can lie between two sampled hosts, and within-host diversity can produce several lineages. A proposed inference should therefore allow unsampled intermediates and uncertainty in infection times. Epidemiological contact information can constrain alternatives, but a reported contact is not proof of transmission and an absent reported contact is not proof of no contact. The output should distinguish strongly constrained relationships from those supported only by a convenient sampling pattern. Confidence in a sequence alignment does not transfer automatically to confidence in who infected whom.
Sampling policy can create an apparent cluster
If sequencing is concentrated in one hospital or one period, the resulting tree can appear to identify a geographically or temporally coherent outbreak even when the pattern partly reflects observation. A sensitivity analysis would vary the inclusion of densely sampled groups and compare inferred links with the known testing policy. A prospective validation could freeze the model, then evaluate predictions against later sequences and independently collected timing information. Such validation tests predictive coherence rather than retrospectively rewarding a narrative that fits every available observation. The Poisson example in this review illustrates limited genetic resolution; it is not a complete transmission likelihood.
A model that can be challenged
The four equations below are a compact analytical model, not a joint fit to all the cited papers. Their interpretation is as follows. A simple clock gives substitution count K over genome length L and elapsed time; rate variation and recurrent substitutions can invalidate it. Zero observed substitutions remain likely when expected clock change is small; identity does not prove direct transmission. For m infections independently sampled with probability q, this gives complete-chain observation; real surveillance can be correlated. A schematic posterior for transmission history T uses genomic G and epidemiological E evidence; factorization requires appropriate conditional assumptions.
The observational target is sets of transmission histories compatible with genomes and dates. The model deliberately isolates a tractable mechanism; its purpose is to reveal which measurements would distinguish that mechanism from an alternative. Parameter values in the figures are declared illustrative inputs. A curve produced by those values is a mathematical consequence, not an estimate of an unmeasured biological or physical quantity.
A discriminating validation design
The primary comparison should test calibrated recovery of known aggregate transmission features. The unit of independent replication is independent outbreak with a documented sampling scheme; repeated readings from the same unit improve precision but do not create independent replication. A strong validation would hold out different surveillance intensities before choosing thresholds or fitting nuisance corrections. In particular, unsampled infections and within-host diversity must be measured, constrained or varied in a sensitivity analysis. Report both the principal estimate and how it changes when that assumption is relaxed. A model that succeeds only after choosing the most favorable exclusion rule has answered a different question from one evaluated with a locked rule.
Worked numerical analysis
For an expected clock change of 0.5 substitutions, the probability of no change is exp(-0.5), about 0.607. This illustrative number is not an Ebola mutation-rate estimate. If each of five infections is sampled independently with probability 0.7, complete observation has probability 0.168. The figures vary expected clock change and sampling coverage separately, showing why an apparently precise tree may leave many host-level histories unresolved.
These calculations can be reconstructed from the companion Python file and its parameter table. Axis labels retain the model's units, and the caption distinguishes the quantities varied from those held fixed. The numerical examples were selected to expose a dependency, not to reproduce the appearance of a published figure. A useful independent check is to evaluate a limiting case and then recompute an intermediate point without the plotting code. Agreement validates the arithmetic within the declared model; it does not establish that nature follows that model.
Evidence, transfer and next steps
The scope of the conclusion is limited by unsampled infections and within-host diversity. Transfer to different surveillance intensities requires evidence beyond fitting the original observations. A future replication should preserve raw measurements, calibration records, exclusions and a machine-readable link between each result and the corresponding analysis. The evidence table below identifies what each selected primary study contributes. The comparison is a focused narrative synthesis, not a systematic review or a claim that all subsequent evidence has been surveyed. The proposed study has not been performed here. Its value is that a negative result would constrain an explicit explanation rather than merely lower a benchmark score.
A declared analytical model
Four equations, explicit assumptions
(1) A simple clock gives substitution count K over genome length L and elapsed time; rate variation and recurrent substitutions can invalidate it.
(2) Zero observed substitutions remain likely when expected clock change is small; identity does not prove direct transmission.
(3) For m infections independently sampled with probability q, this gives complete-chain observation; real surveillance can be correlated.
(4) A schematic posterior for transmission history T uses genomic G and epidemiological E evidence; factorization requires appropriate conditional assumptions.
Constructed examples · Reproducible data
Inspect the quantitative argument
These curves are calculated from the declared models. They are not observations from the cited studies. Every figure includes its numeric data and vector version.


Which evidence answers which question?
| Evidence or design choice | What it identifies | What remains unresolved |
|---|---|---|
| Source 1 | Genomic surveillance contributed to reconstruction of an Ebola outbreak. | Genetic ancestry and direct host-to-host transmission differ. |
| Source 2 | Portable sequencing enabled outbreak-time genomic observation. | Operational speed does not eliminate sampling or sequence uncertainty. |
| Source 3 | Inference methods represented partially sampled ongoing outbreaks. | Results remain conditional on transmission and sampling models. |
| Primary observable | sets of transmission histories compatible with genomes and dates | unsampled infections and within-host diversity |
| Independent test | calibrated recovery of known aggregate transmission features | Requires new measurements |
| Transfer set | different surveillance intensities | Not validated by the constructed numerical example |
A proposed validation protocol
This is a proposed evaluation design. No new biological experiment, clinical trial or physical experiment was carried out for this article.
- Specify sets of transmission histories compatible with genomes and dates before fitting.
- Retain independent identifiers for each independent outbreak with a documented sampling scheme.
- Separate different surveillance intensities from model development.
- Measure or bound unsampled infections and within-host diversity.
- Record units, calibration and the observation operator.
- Compare the primary model with a named rival explanation.
- Prespecify the test: calibrated recovery of known aggregate transmission features.
- Archive raw data, exclusions, parameter files and executable analysis.
What the primary sources establish
Stephen K. Gire, Augustine Goba, Kristian G. Andersen et al. · 2014 [1]
Contribution. Genomic surveillance contributed to reconstruction of an Ebola outbreak.
Boundary. Genetic ancestry and direct host-to-host transmission differ.
Source locator. Abstract / selected primary-source sections; see linked bibliographic record.
Joshua Quick, Nicholas J. Loman, Sophie Duraffour et al. · 2016 [2]
Contribution. Portable sequencing enabled outbreak-time genomic observation.
Boundary. Operational speed does not eliminate sampling or sequence uncertainty.
Source locator. Abstract / selected primary-source sections; see linked bibliographic record.
Xavier Didelot, Christophe Fraser, Jennifer Gardy et al. · 2017 [3]
Contribution. Inference methods represented partially sampled ongoing outbreaks.
Boundary. Results remain conditional on transmission and sampling models.
Source locator. Abstract / selected primary-source sections; see linked bibliographic record.
Limits of this analysis
- Genetic ancestry and direct host-to-host transmission differ.
- Operational speed does not eliminate sampling or sequence uncertainty.
- Results remain conditional on transmission and sampling models.
- Companion figures are constructed analytical examples, not new experimental results.
- Transfer to different surveillance intensities has not been demonstrated by this review.
A focused narrative analysis of the named primary studies, not a systematic literature search or a claim to comprehensive coverage through 2026.
Questions that would change the conclusion
- Which additional dates most reduce transmission ambiguity?
- How sensitive are inferred links to unsampled intermediates?
- When does within-host variation add calibrated information?
References
- Stephen K. Gire, Augustine Goba, Kristian G. Andersen et al.. Genomic surveillance elucidates Ebola virus origin and transmission during the 2014 outbreak. Science (2014). 10.1126/science.1259657.
- Joshua Quick, Nicholas J. Loman, Sophie Duraffour et al.. Real-time, portable genome sequencing for Ebola surveillance. Nature (2016). 10.1038/nature16996.
- Xavier Didelot, Christophe Fraser, Jennifer Gardy et al.. Genomic infectious disease epidemiology in partially sampled and ongoing outbreaks. Molecular Biology and Evolution (2017). 10.1093/molbev/msw275.
Bibliographic identity checked against Crossref. Interpretation uses accessible primary records, abstracts and selected text; full-text and supplementary-methods coverage is not exhaustive.
Authorship and provenance
Source-based research review and original mathematical analysis written by Codex (AI). Cited experiments belong to the cited research teams.
Concept cover created with the built-in ImageGen tool. Quantitative figures are explicit constructed analyses, with code and numerical data; they are not measurements from the cited papers.
This local draft has no independent peer-review or journal-acceptance record.