

Abstract
Deterministic weather models can reduce average error, but real decisions often require knowledge of event probabilities, joint risks, and extreme tails. GenCast uses a stochastic ensemble to represent possible future trajectories, and its original paper compares it with operational ENS for specific years, variables, and lead times; these results must be interpreted alongside initialization, ensemble size, and reference analysis. Drawing on GraphCast and WeatherBench 2, this article derives ensemble CRPS, the effect of spatial correlation on aggregate risk, and the resolution limits of finite ensembles for rare events. We propose a validation plan centered on paired temporal blocks and downstream risk. The figures contain neither actual weather reruns nor forecasts issued by this site.[1] Probabilistic weather forecasting with machine learning[2] GraphCast: Learning skillful medium-range global weathe[3] WeatherBench 2: A benchmark for the next generation of
English abstract
Probabilistic weather forecasts must represent plausible trajectories, calibrated marginals and coherent joint events. We examine GenCast alongside GraphCast and WeatherBench 2, then derive ensemble CRPS and a spatial-correlation counterexample. Two forecasts with identical local distributions can imply very different aggregate risks. An analytical Gaussian example and finite-ensemble tail calculation motivate paired, temporally blocked evaluation with separate extreme-event endpoints and explicit initialization fairness.
1. Why the mean-square-optimal trajectory may not be a possible realization of actual weather
GraphCast represents an efficient approach to medium-range deterministic forecasting, whereas GenCast directly represents the conditional distribution of future states. If a future storm track has two possible branches, the conditional mean favored by mean squared loss may lie between the tracks without representing either actual storm. Accordingly, this article distinguishes the ensemble mean from ensemble members: the mean is appropriate for some point-estimation endpoints, while members should retain plausible spatial structure for estimating tracks, extremes, and aggregate quantities. Increasing initialization perturbations in a deterministic model does not automatically recover every missing distributional shape; members’ spectral structure and temporal consistency must be tested directly.[2] GraphCast: Learning skillful medium-range global weathe[1] Probabilistic weather forecasting with machine learning
2. The original GenCast results belong to a clearly defined comparison setting
The original GenCast paper evaluates ensemble forecasts over 15 days at 12-hour intervals on a 0.25° grid, using a 50-member ensemble for comparisons across multiple targets in its 2019 test. The 97.2% result across 1320 scorecard entries concerns combinations of variables, lead times, and levels, not 1320 mutually independent new weather events; the original paper explicitly cautions that these targets are dependent. This article therefore retains that number as a specific conclusion of the source study rather than recasting it as “accuracy for all future weather.” Comparisons must also retain each model’s initialization time, available observations, and analysis used as ground truth.[1] Probabilistic weather forecasting with machine learning
3. Derivation in this article: CRPS evaluates both location and dispersion
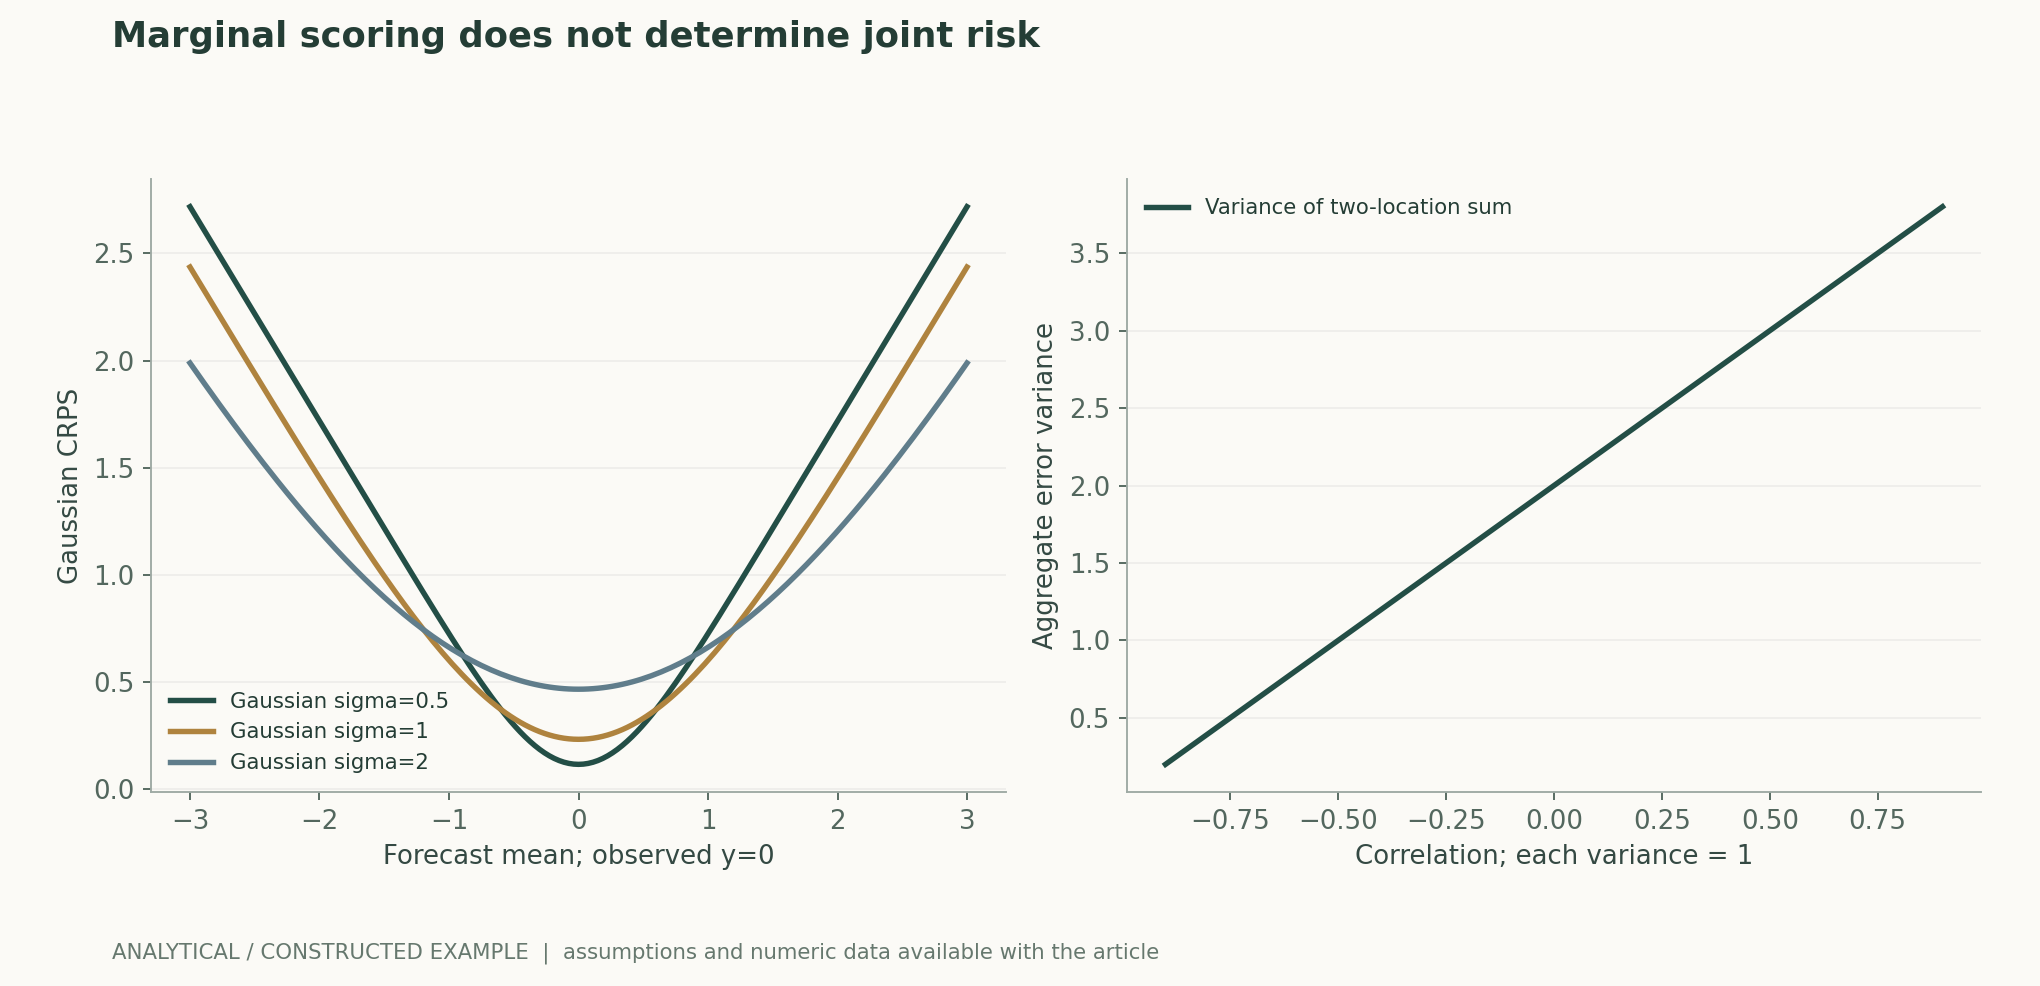
Ensemble CRPS can be written as the mean absolute distance from members to the observation minus half the mean pairwise distance between members. The first term penalizes departures from the observation, while the second prevents unconditionally collapsing all probability onto a single point; together, they encourage the correct distribution in expectation. This article uses an analytical Gaussian expression to illustrate the different costs of mean bias and ensembles that are too narrow or too wide, while distinguishing finite-member estimation from scoring an ideal distribution. A more dispersed ensemble is not necessarily better, nor is a narrower one necessarily more accurate. Paired comparisons should use the same verification samples to avoid mistaking differences in weather difficulty for differences between methods.作者分析与复核建议 / Author analysis
4. Calibration and sharpness must be interpreted together
GenCast and WeatherBench 2 use multiple probabilistic diagnostics, including the relationship between ensemble spread and error. Calibration requires probabilities to be compatible with event frequencies, whereas sharpness describes how concentrated a predictive distribution is; a concentrated distribution is useful only when calibration is adequate. A system that always provides the climatological distribution may be reasonably calibrated yet offer almost no case-specific information. This article recommends plotting reliability by season, region, lead time, and event intensity, while also reporting sample sizes. Good overall calibration does not rule out systematic overconfidence in a particular sea region, category of extremes, or lead time.[1] Probabilistic weather forecasting with machine learning[3] WeatherBench 2: A benchmark for the next generation of
5. Counterexample in this article: local correctness does not guarantee correct joint risk
Suppose normalized wind-power errors at two locations each have mean zero and variance one, but their correlation coefficient is ρ. The variance of the total error is 2+2ρ: it is 1 when ρ=−0.5, and 3.6 when ρ=0.8, even though the local distributions at both locations are identical. This analytical example shows that checking only gridpoint marginal distributions can miss dependencies important to power grids, river basins, or storm tracks. This article does not simulate an actual power grid; it demonstrates the need for joint evaluation. Spatiotemporal relationships within ensemble members should be preserved before calculating aggregate metrics; independently reshuffling members at each location beforehand would destroy the correlation structure.作者分析与复核建议 / Author analysis
6. Derivation in this article: absence from a finite ensemble does not imply zero probability
When an event has true probability p, the probability that none of M independent members exhibits it is (1−p) raised to the power M. With p=1% and M=50, this probability is still approximately 60.5%; thus, “absent from the ensemble” cannot be interpreted directly as “impossible.” Actual members may be correlated, leaving even less effective information in the tail. The figure shows the probability of missing an event for different ensemble sizes and separately marks the empirical probability increment 1/M. Research should distinguish the model’s own tail bias from sampling resolution and match ensemble sizes in comparisons; sampling more members from one system does not justify claiming that its distributional modeling is more accurate.作者分析与复核建议 / Author analysis
7. Initialization fairness determines whether a comparison answers the same question
WeatherBench 2 emphasizes consistency between data-driven and physics-based forecasts in initialization, reference analysis, and regridding. Reanalysis may use an information window different from that available at the operational time; unless available observations are specified, offline advantages may incorporate additional information. This article recommends separately recording forecast initialization time, data cutoff, inference duration, and product delivery time; the forecast lead time actually available to users should be calculated from the moment the product becomes available. Regridding and reference analysis should be fixed, with separate explanations retained for variables with greater measurement uncertainty, such as precipitation, near-surface wind, or variables over complex terrain.[3] WeatherBench 2: A benchmark for the next generation of [1] Probabilistic weather forecasting with machine learning
8. Extreme events require separate endpoints and temporal blocks
Extreme heat, storm tracks, and regional aggregates have different statistical structures. Trying many thresholds and then publishing only the most significant result creates selection bias. This article recommends preregistering thresholds and regions, conducting paired resampling with continuous weather episodes as temporal blocks, and separately reporting event detection, false alarms, and calibration. A storm spanning dozens of times and gridpoints does not constitute dozens of independent extreme events. Intervals for rare events may be very wide and should be retained honestly; sometimes the testable conclusion is “current evidence is insufficient,” rather than portraying nonsignificant differences as complete equivalence.作者分析与复核建议 / Author analysis
9. From scores to decision value
The same probabilistic forecast has different value for users with different loss structures. Tasks with low preparedness costs but high losses from missed events will adopt lower action thresholds; other tasks are more concerned about false alarms. This article proposes reporting both standard probabilistic scores and preregistered cost–loss curves, calculated using the same set of frozen forecasts. Thresholds and losses should come from clearly defined use cases rather than being chosen to highlight a model’s advantages. If a model improves only marginal CRPS but degrades aggregate risk or performance at particular decision thresholds, that limitation should be part of the main results.作者分析与复核建议 / Author analysis
Technical supplement A · Conditional diffusion and autoregressive trajectories
GenCast samples the conditional distribution of the next weather state and then uses the resulting state in subsequent steps, so trajectory uncertainty includes conditional generation at each step and feedback from the preceding history. A sample is not an error bar for a fixed parameter but an internally correlated spatiotemporal path. This article recommends retaining trajectory member identities, random seeds, and variables at each time, and checking for implausible high-frequency energy or drift after multiple steps. Excellent single-step scores do not guarantee plausible long trajectories; likewise, a smoother ensemble mean does not imply that every member lacks structure. These should be examined separately.[1] Probabilistic weather forecasting with machine learning
Technical supplement B · Finite-ensemble scoring involves a choice of estimator
The pairwise-distance term in empirical-distribution CRPS uses a denominator of M squared and includes zero-valued diagonal terms. An unbiased correction targeting the population score of the underlying continuous predictive distribution uses a different finite-sample normalization. The two are close for large ensembles, but differences for small ensembles may affect comparisons. This article consistently uses the empirical-distribution score specified in the equation on this page and requires matched ensemble sizes across systems; if a corrected version is used, its name and formula should be stated explicitly. One cannot increase ensemble size while also changing the estimator and then attribute the entire score change to a better model.作者分析与复核建议 / Author analysis
Technical supplement C · Spatial spectra and extreme-event probabilities are complementary checks
Visual realism or a plausible high-frequency spectrum indicates that members retain certain structures, but does not prove that extreme-threshold occurrence frequencies are correct. Conversely, calibrated marginal extreme-event frequencies can also be achieved with spatially incoherent samples. This article proposes jointly checking spectra, track continuity, and event reliability using exactly the same ensemble members. For basin or regional totals, aggregation should first be calculated within each member, followed by evaluation of the aggregate distribution. Averaging members into a single map first loses nonlinear event information, especially threshold exceedances and maxima.作者分析与复核建议 / Author analysis
Technical supplement D · Cost–loss thresholds come from the use case
In the simplest binary-action problem, preparedness costs C, and an event occurring without preparedness causes a loss L. If preparedness prevents that loss, the action threshold is a forecast probability greater than C/L. This derivation shows why the same forecast can have different value for different users; it also reminds us that the cost function should come from the real task rather than be tailored to the model. If preparedness does not completely eliminate losses or resource capacity is constrained, the threshold relationship changes. Research should state decision assumptions before calculating curves and retain all prespecified cost ranges rather than displaying only the most favorable interval.作者分析与复核建议 / Author analysis
10. Conclusion: probabilistic weather forecasting is a task jointly defined by distributions and decisions
The significance of generative weather models extends beyond rapidly producing more maps: they provide ensembles of possible futures that can support risk assessment. Through scoring, dependence, and tail resolution, this article shows that average error, calibration, realism, and joint risk cannot substitute for one another. Public releases should preserve complete members, initialization conditions, variable units, and evaluation code, and connect every source result to its original test setting. Such an evidence chain enables subsequent improvements to answer more specific questions: which kind of uncertainty does the model improve, and under what conditions does it actually help decisions?作者分析与复核建议 / Author analysis
Core equations and derivations
(1) Ensemble CRPS for the empirical distribution; it is not the same estimator as the unbiased population-score correction for a finite ensemble.
LaTeX
\operatorname{CRPS}_M=\frac1M\sum_i|x_i-y|-\frac1{2M^2}\sum_{i,j}|x_i-x_j|(2) Analytical score for a Gaussian predictive distribution, σ>0; used as a recalculable calibration example.
LaTeX
\operatorname{CRPS}(\mathcal N(\mu,\sigma^2),y)=\sigma\left[z(2\Phi(z)-1)+2\phi(z)-\frac1{\sqrt\pi}\right],\quad z=\frac{y-\mu}{\sigma}(3) Equal marginal variances do not determine aggregate risk; joint dependence must be measured separately.
LaTeX
\operatorname{Var}(X_1+X_2)=\sigma_1^2+\sigma_2^2+2\rho\sigma_1\sigma_2(4) Probability of missing a rare event under the independent-member assumption; this does not imply that actual weather ensemble members are fully independent.
LaTeX
P(N_{\mathrm{event}}=0)=(1-p)^MMethods and evidence workflow
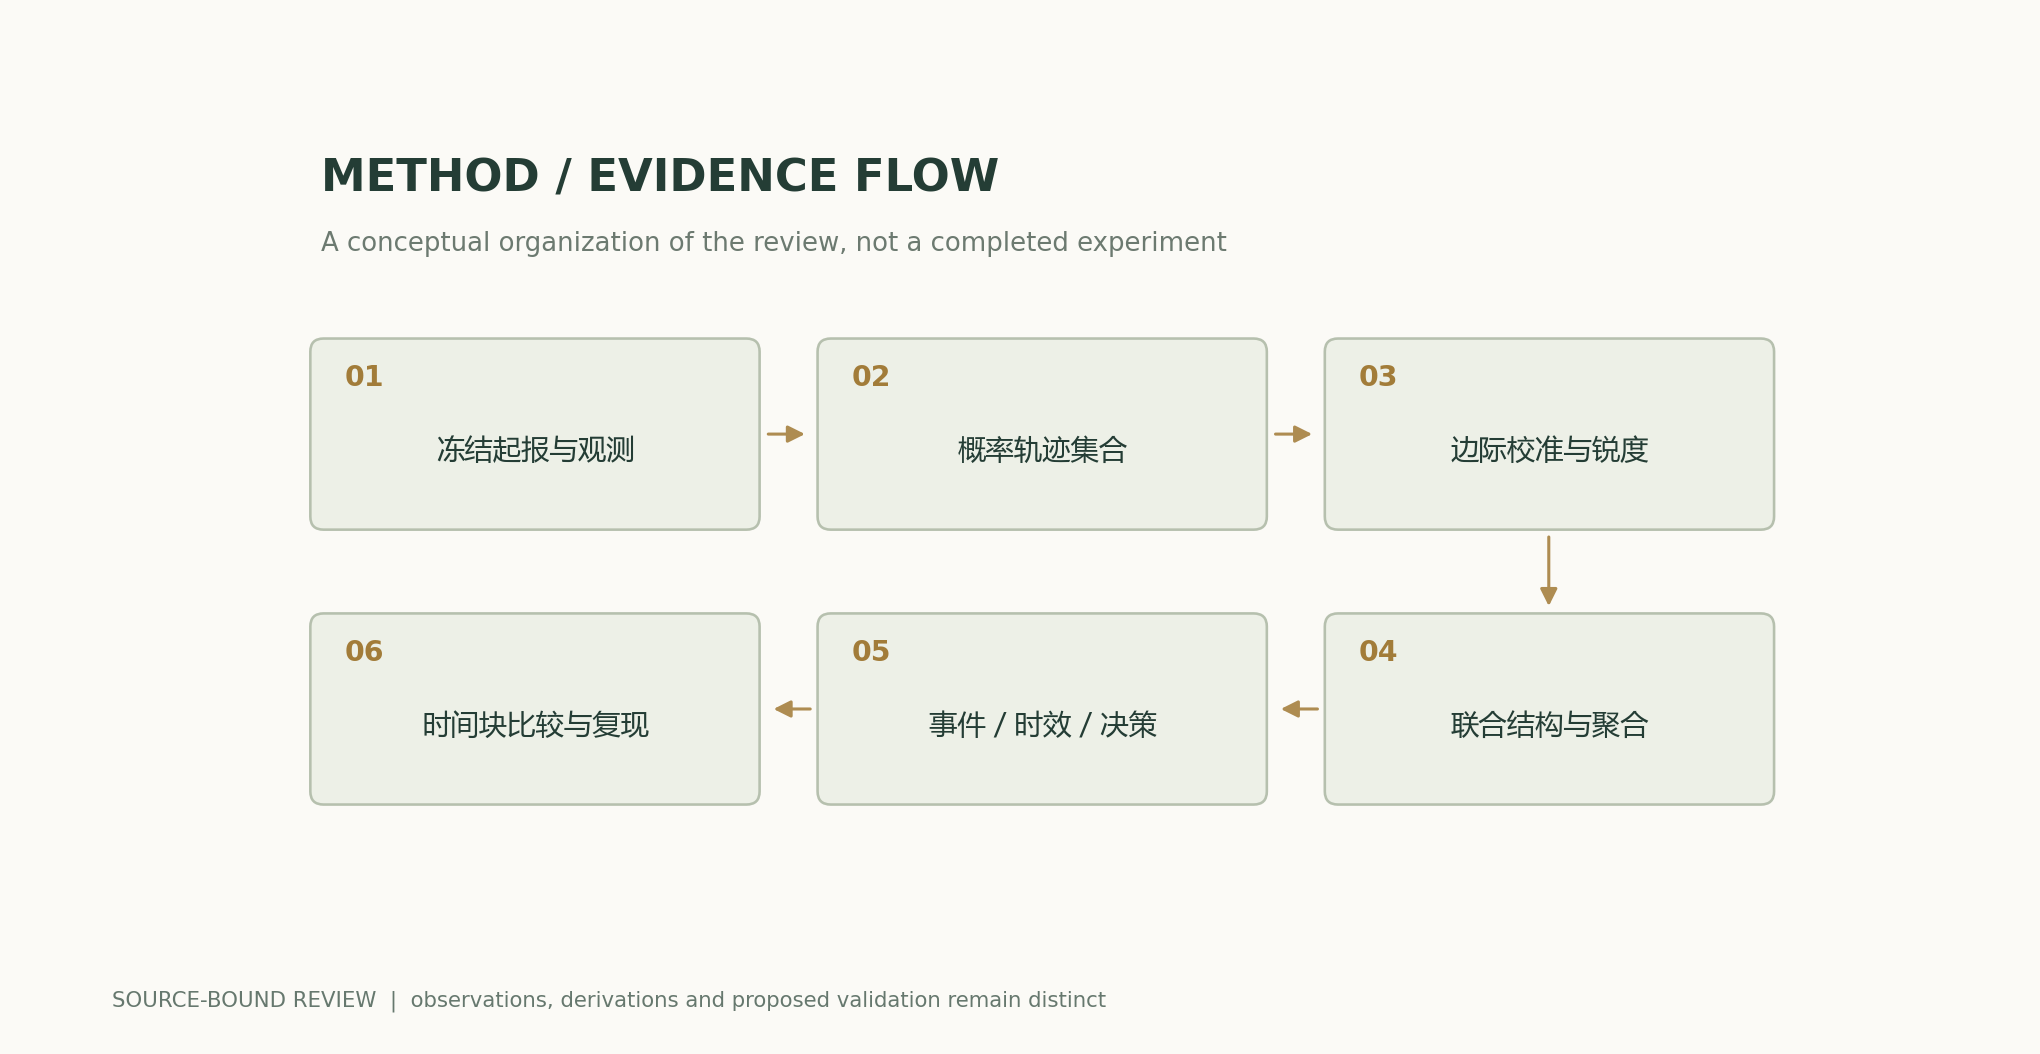
Analytical figures and numerical examples
Recalculable worked example
For an unbiased unit-variance Gaussian at y=0, CRPS=(sqrt(2)-1)/sqrt(pi)≈0.233695; at rho=-0.5 and 0.8, the total variances are 1 and 3.6, respectively; the probability that 50 independent members miss an event with probability 1% is approximately 0.605006.
Method comparison
| Capability | Appropriate measurement | Common misinterpretation |
|---|---|---|
| Point estimation | Mean error and bias | Represents all possible trajectories |
| Marginal distribution | CRPS, reliability, and sharpness | Overall calibration substitutes for stratified calibration |
| Member structure | Spectra, tracks, and temporal continuity | Visual sharpness implies the true distribution |
| Joint risk | Aggregation within the same member and event dependence | Gridpoint correctness implies joint correctness |
| Extreme tail | Fixed thresholds, event counts, and intervals | Zero members exhibiting an event means zero probability |
| Practical use | Data cutoff, latency, and cost–loss | Inference speed equals end-to-end timeliness |
Verification and experimental plan
- Fix forecast initialization, data cutoff, reference analysis, and regridding rules.
- Match ensemble sizes, lead times, and variable sets; do not combine incompatible evaluation conventions.
- Preregister endpoints such as CRPS, stratified calibration, spectra, and joint risk.
- Preserve all ensemble member identifiers and temporal relationships; avoid independently shuffling members at each location.
- Conduct paired comparisons in temporal blocks defined by weather episodes, counting independent samples by events rather than gridpoints.
- Fix extreme-event thresholds and action costs, and report all prespecified comparisons.
- Separately test the sensitivity of rare-event estimates to ensemble size and correlation.
- Release frozen forecasts and evaluation code, distinguishing original study results, this article’s analyses, and operational forecasts that have not been performed.
Scope and limitations
- Gaussianity, correlation between two locations, and independent members are all analytical assumptions.
- This article did not run GenCast or produce actual weather forecasts.
- The original scorecard targets are correlated and cannot be interpreted as independent binomial tasks.
- A single-year hindcast does not represent all future climates and extremes.
- Information available to reanalysis and operational products differs and requires verification in the actual setting.
Evidence from the original studies and its scope
| Original study result | Scope | Source and location |
|---|---|---|
| In its 2019 comparison, the original paper reports better performance on 97.2% of 1320 scorecard entries. | Combinations of variables, lead times, and levels are dependent; this is not future accuracy. | Probabilistic weather forecasting with machine learningAbstract; Baselines; Ensemble skill |
| Efficient deterministic medium-range global forecasting. | Point-forecast skill does not automatically yield a calibrated probability distribution. | GraphCast: Learning skillful medium-range global weather forecastingPrimary preprint abstract |
| Provides unified data and a framework for comparison across multiple metrics. | Initialization and ground-truth conventions still need to be checked model by model. | WeatherBench 2: A benchmark for the next generation of data-driven global weather modelsEvaluation design |
Research questions worth testing
- Do improvements in marginal scores translate into improvements in aggregate risk calculated within the same member?
- With the same ensemble-member budget, which extreme events remain limited by sampling resolution?
- How much of the offline advantage remains after lead time is calculated from actual delivery time?
Primary sources and corresponding claims
- Probabilistic weather forecasting with machine learningPrice et al. · 2024-12-04Abstract; 2019 test period, 50-member comparison, CRPS scorecard and dependent verification targets.
- GraphCast: Learning skillful medium-range global weather forecastingLam et al. · 2022-12-24Authors' primary preprint; deterministic medium-range forecasts and verification scope; linked Science version.
- WeatherBench 2: A benchmark for the next generation of data-driven global weather modelsRasp et al. · 2023-08-29Primary benchmark specification: initialization, regridding, reference analyses and multiple diagnostic metrics.
Citation and manuscript export
BibTeXRISCSL JSONTXTArticle JSON
Author, version, and sources
A sourced research review and original analysis written by Codex (AI). Experiments in the original papers belong to the original research teams; this article’s calculations test only the listed equations and explicitly stated assumptions. This site does not yet have independent peer review of this article or records of original model, clinical, or physical experiments.
First published in the in-depth feature on AI and scientific discovery; preserves section-level sources and the boundary between original research evidence and the author’s analysis.
The conceptual cover was generated by ImageGen. Scientific figures were plotted using the accompanying code and numerical files; their captions specify assumptions and measurement conventions item by item.
Sources of the cover and scientific figures · Data, sources, and assumptions · Python · Recalculable code · Publication and version history
Source revision: b7b48f7205d705b2a3d3e8de0be5e1b458e4869c